

This post is a continued look at the number of patent applications being filed by technology area. See previous posts here and here and here.
There is a lot of roaring of terrible roars and gnashing of terrible teeth around the state of the patent system these days. The ongoing wild rumpus was the inspiration this post in which I concluded the number of patent applications prepared and filed first in the U.S. appears to have been flat since at least 2002. The motivation for the post – and the data contained therein – was not commentary on the state of “innovation” in the U.S. Rather, it was was my attempt to quantify how much prep and pros work there is to be had among those of us who do such work for a living (Alas, this blog and free examiner stats do not keep two children clothed and fed).
This post expands on that post by digging deeper into the number of patent applications filed by technology. The hope going in was of course that there is still plenty of work for my EE brethren and me, and that it is the mechanical, chemical, and bio engineers who need to pick up a shift at the banana stand (where, of course, there is always money).
As a reminder, my proxy for applications prepared by U.S. practitioners are those which are neither continuations nor divisionals, and which do not have a claim of foreign priority.
Classes with the Most Patent Applications Prepared in the U.S. in 2017
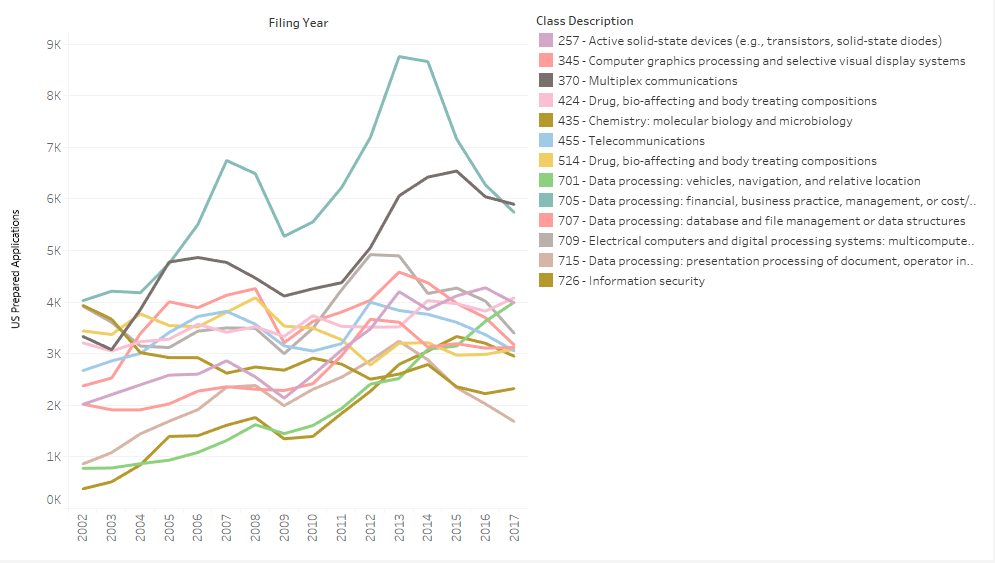
Look at that, it took until 2017 for business methods (class 705) to relinquish the top spot to multiplex communications (class 370). Multiplex communications, however, is also trending down trajectory (presumably due to 5G coming out of development and into mass production). If the shown trajectories continue, class 701 (software for autonomous vehicles) would soon take over the top spot. Given recent developments at the PTO, however, I wouldn’t be surprised to see business methods recover and reclaim the throne.
One other note here is that, assuming companies are not repeatedly slamming their heads against the wall and expecting different results, increasing filings in some “software” classes such as 701 suggests they are having success there (In fact this is supported by all-time high allowance rates at the PTO). This supports my own anecdotal experience that claiming “software” is not a problem per se – it’s claiming software that performs a business method is a problem (Good advice is to reframe your business method as a technical invention).
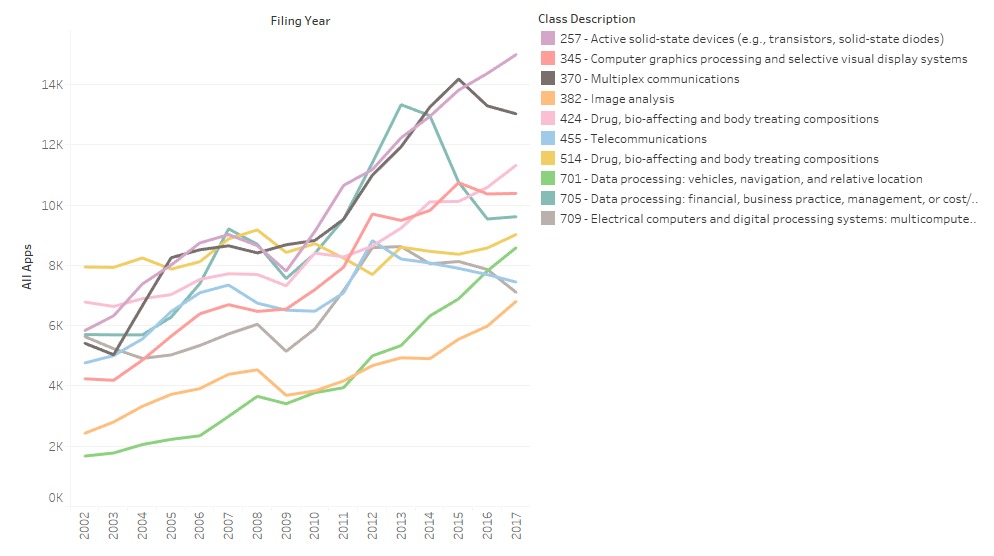
Classes with the Most Total Applications Filed in 2017
For comparison, here are the top classes for total filings (i.e., counting continuations, divisionals, and applications with foreign priority).
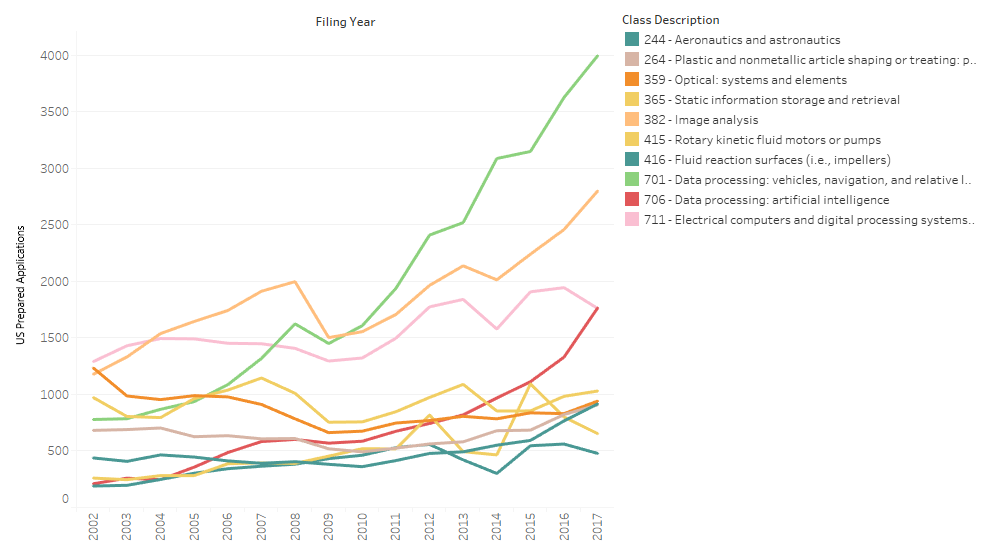
Highest Growth Classes for Applications Prepared in the U.S. from 2014-2017
Here’s a look at which classes are growing fastest (in absolute numbers). “AI” has gone exponential. Will it go plaid next?
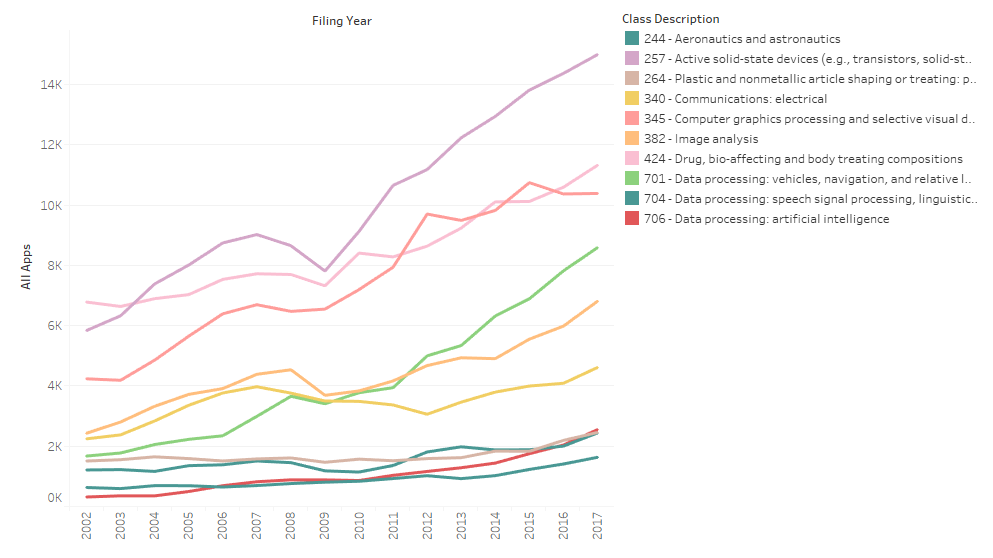
Highest Growth Classes for Total Applications from 2014-2017
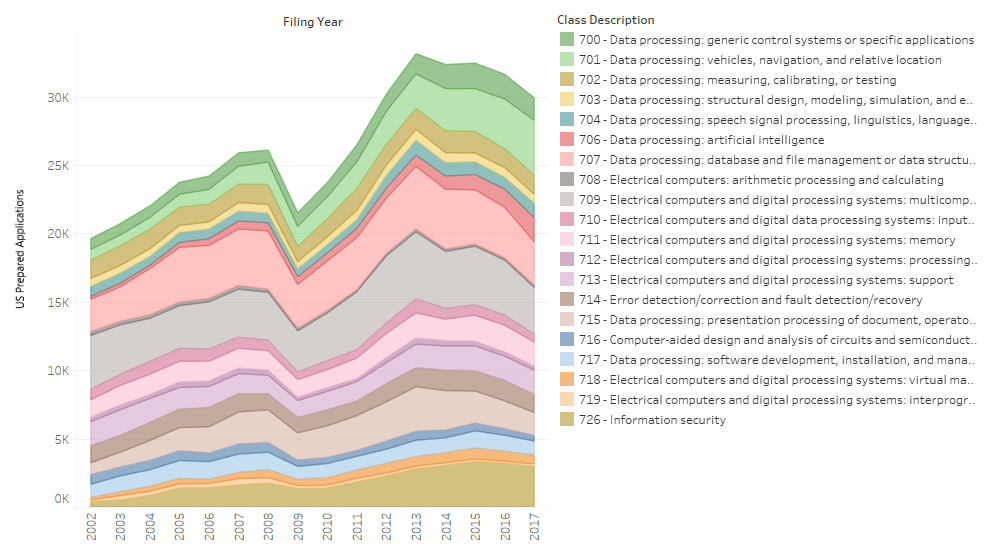
U.S. Prepared “Software” Applications
Here’s a look at total filings in classes which I deemed to be “software” classes. Note I have excluded business methods.
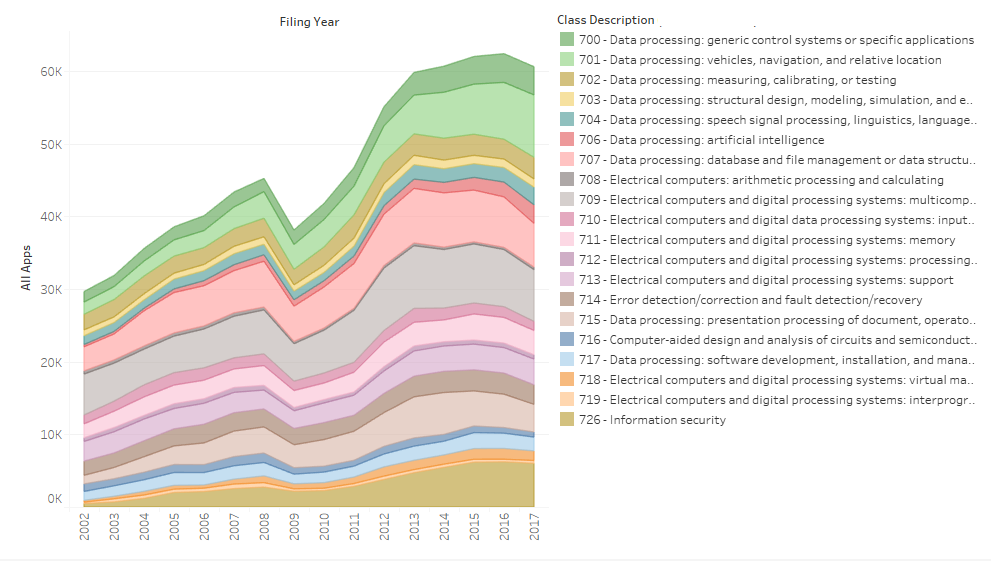
All “Software” Applications
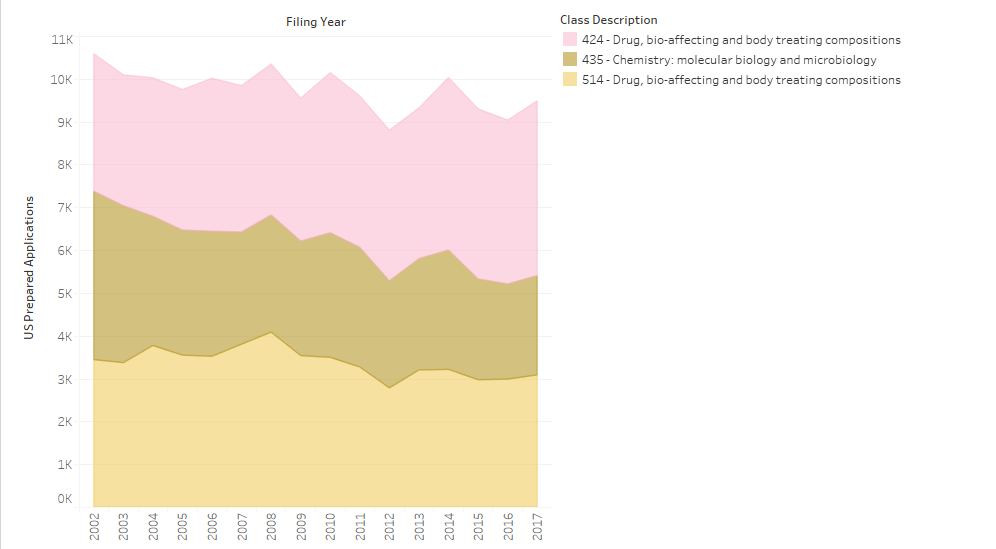
U.S. Prepared “Bio” Applications
Admittedly, I know next to nothing about bio applications, but the descriptions of three classes seemed to be the applicable ones. Any bio readers are welcome to suggest improvements
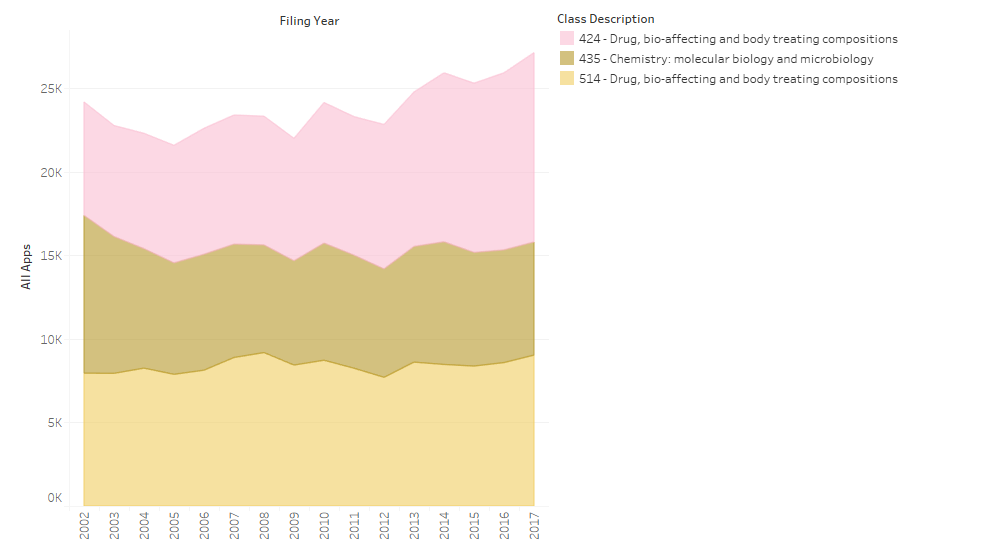
Total “Bio” Applications
So there you go. Sorry I included static images instead of interactive visualizations but: (a) Tableau visualizations often are slow to load and/or don’t look great on different displays; and (b) I was too lazy to generate interactive visualizations using another tool.