

Special thanks again to Harry Vartanian (follow him on Twitter @harryv257) for providing inspiration and feedback on this post (although all opinions and assumptions expressed in this post – especially the dumb ones – are my own).
I previous wrote (here) that Alice seemed to have cause decreased patent filings in certain technologies but that overall U.S. patent filings seemed to be slightly down — especially when compared to the overall health of the economy. Indeed the PTO’s annual report noted that overall U.S. utility patent filings where down for second straight year in 2018 (and for the third time in four year). The only other year in the past 20 years in which filing was down was in 2009 after the great recession hit (it also caused a lot of abandonments of already-filed applications, as can be seen in IBM’s abandonment numbers ) Below is the table (the full report is here)
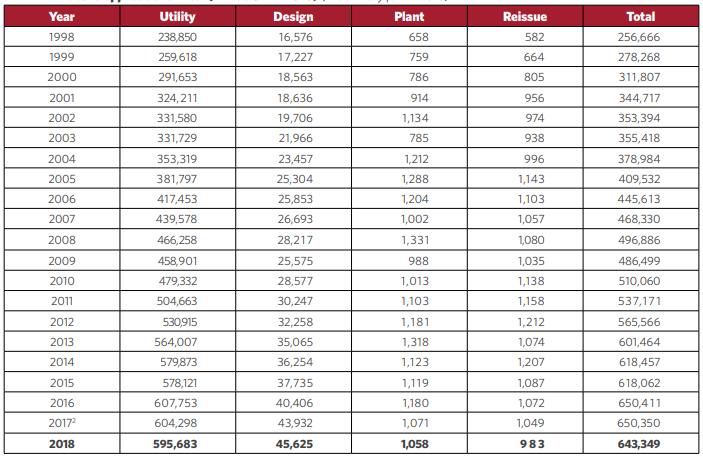
That said, the overall drop in utility applications is still pretty small (down only about 2% from the all-time high in 2016) — basically treading water. So it does not appear the PTO will be strapped for cash anytime soon (especially if the proposed fee increases all go through). But, what about U.S. practitioners? Does this mean the amount of patent preparation and prosecution work is at least treading water? That’s what I wanted to dig into this week.
To estimate the number of applications being prepared by U.S. practitioners, I used data from public PAIR to count the number of published applications filed each year. This is the orange line in the chart below[1]. To better approximate applications being drafted I excluded applications which were continuations and divisionals (I left in continuations-in-part under the assumption that at least some drafting is going on there). This is the blue line. Then I removed application which claim priority to a foreign application on the assumption that the bulk of the drafting was performed by foreign counsel. This results in the gray line.
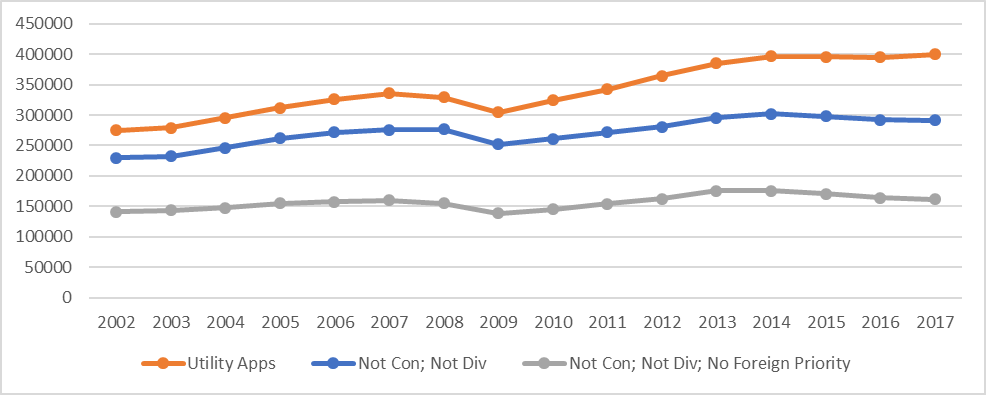
As you can see, the gray line is basically flat from 2013 to 2014 and then has fallen each year since (2018 and 2019 numbers are of course incomplete due to 18 month publication delay). In fact, the gray line is basically flat since 2002!
Below is the third (gray) line broken down by entity types. Here you can see that domestic drafting work for undiscounted (i.e., “large”) entities saw the biggest drop post-Alice, but is still up slightly over the 15 year period. Domestic patent drafting work for small entities never recovered their pre-great-recession peak, and has been further dropping since Alice.
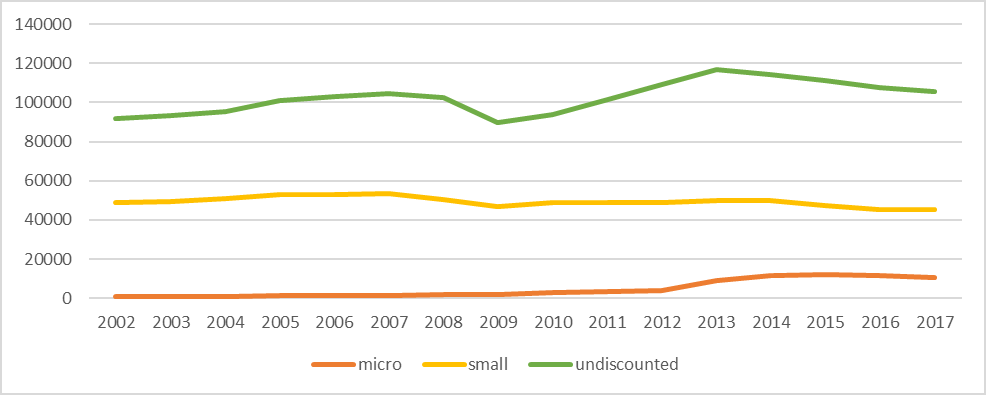
So, under the assumptions I made above, it appears that the demand for U.S. based patent drafting services is stagnating right along with the stagnation (and pending collapse) in the number of registered patent practitioners. Also may at least partially explain why the cost (read “revenue” for practitioners) of a patent application has also been stagnant.
[1] The astute reader will notice that the numbers are significantly lower than those listed in the USPTO PAR table above (by 17% in 2002 and rising to 32% in 2014). First, I used calendar year instead of fiscal year. Second, I previously estimated that about 5% of applications have nonpublication requests, so that accounts for only some of the discrepancy. But I believe most of the discrepancy is that the PAR counts every application filed, even if it was never formally assigned an application (and thus will not be in public PAIR). I believe this because (as I will discuss in a forthcoming post – don’t forget to subscribe!) I know that the number of reissue applications listed in the PAR is much higher than the number that were actually assigned an application number.
Pingback:Patently-O Bits and Bytes by Juvan Bonni | Patently-O
Pingback:Links 9/9/2019: Linux 5.3 RC8, DXVK 1.3.4, Debian 9.11 | Techrights