

Guest post by Dunstan H. Barnes
Today’s guest post is the (rather overdue) third and final post in a three-part series of guest posts answering the question: how often are design patents rejected?. (You can find the first two posts here and here and here). In this third guest post, we have included USPTO data regarding abandoned US design applications to get a better estimate of the true number of design patent applications that go “straight through” from filing to issuance without receiving any office actions.
Here, we have included data from the USPTO’s Fiscal Year 2019 Performance and Accountability Report in combination with the data reported in our earlier guest posts to calculate a more accurate estimate of the percentage of design patent applications that issue without receiving any rejections. More specifically, we expect that fewer than 70.7% of design patent applications are allowed without receiving an office action, because this rate was calculated based on published design patent applications, which (apart from Hague applications) are not published unless they issue. Thus, in the study we reported in our last two guest posts, we were not able to include abandoned design patent applications. By now including abandoned design application data from the USPTO’s FY 2019 report, we are able to modify our calculated rate of 70.7% to reflect what we believe to be a more accurate rate.
Before getting to the number itself, we must acknowledge that our estimated rate depends on several crucial assumptions:
- All abandoned applications received at least one rejection. Even though there may be applications that were preemptively abandoned by applicants who filed and then changed their minds before receiving a rejection or notice of allowance, or who abandoned because they did not wish to pay the issue fee, we believe this assumption to be mostly accurate.
- We have summed the data from 2015-19 provided in the USPTO’s FY 2019 reports and calculated our numbers based on the total numbers of design applications issued and abandoned in that timeframe. To confirm that the total number of applications seems accurate, with our assumptions, we have compared it to the number of applications filed in 2014-19 by including 2014 data from the USPTO’s FY 2018 report (available at https://www.uspto.gov/sites/default/files/documents/USPTOFY18PAR.pdf). We note that despite including additional data, there is slight discrepancy in the numbers, because there were 250,829 total design applications filed between 2014-19, but a total of only 247,645 applications between 2015-19 which either issued, were abandoned, or are currently pending (146,219 that issued, 28,874 that were abandoned, and 72,552 that are currently pending). The reason for not including cases that issued or were abandoned in 2014 is in an effort to reduce the number of cases that were filed prior to 2014 but that issued or were abandoned between 2015 and 2019. However, the remaining discrepancy of 3,184 is most likely attributable to cases filed prior to 2014 that issued or were abandoned in 2015-19.
- Apart from acknowledging the number of pending applications for purposes of ensuring the number totals seem accurate, we did not include any of the 72,552 pending applications (not even the 9,553 that currently have received at least one rejection) in our analysis.
- We are applying our 70.7% rate to the numbers of applications that issued as disclosed in Table 1 of the USPTO’s FY 2019 report (see page 166 of the report) to calculate a number of applications that we would expect to go “straight through” based on our study.
- Finally, we are assuming that the 70.7% rate found during our study of about 1,750 design patents that issued in late 2017 can be more broadly applied as representative of the rate at which the 146,219 design patent applications that issued between 2015 and 2019 went through to issuance without receiving an office action.
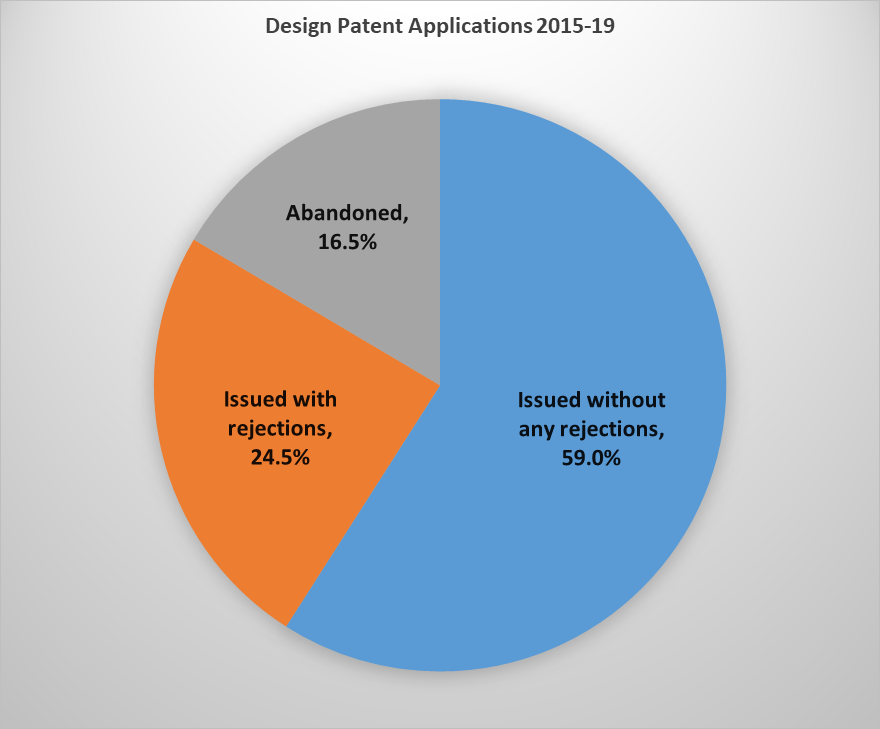
The calculation: We start our calculation by multiplying the 70.7% rate from our study (see our first guest post) to the total number of design patent applications (146,219) that issued between 2015 and 2019 to obtain an estimate of the number of issued design patent applications that went “straight through” without receiving any rejections. Next, we divided this number (103,377) by the total number of design patent applications that either issued or were abandoned between 2015 and 2019 (175,093) to obtain an estimate of the percentage of design patent applications that went straight through when also including abandoned applications.
With the above estimates in mind, we obtained the following estimate rate of design patent applications that proceed to issuance without receiving any rejections: 59.0%. Although this estimated rate relies on a series of assumptions, it should be clear that the actual rate of design patents that issue having received zero rejections is below both (1) the 81.6% rate reported in Dennis Crouch’s 2010 study and (2) the 70.7% rate reported in our first guest post. Our estimated rate is shown graphically in the below pie chart:
As before, a big thank you to the following individuals: Christopher V. Carani and Philipp Ruben for their assistance in setting up the present study; Philip Brown, Amber Carpenter, Collin Hansen, Michael James, Donna Kwon, Alan Montera, Autumn Schmidt, and Sean Sparrow, who were each instrumental in collecting data for the present study.