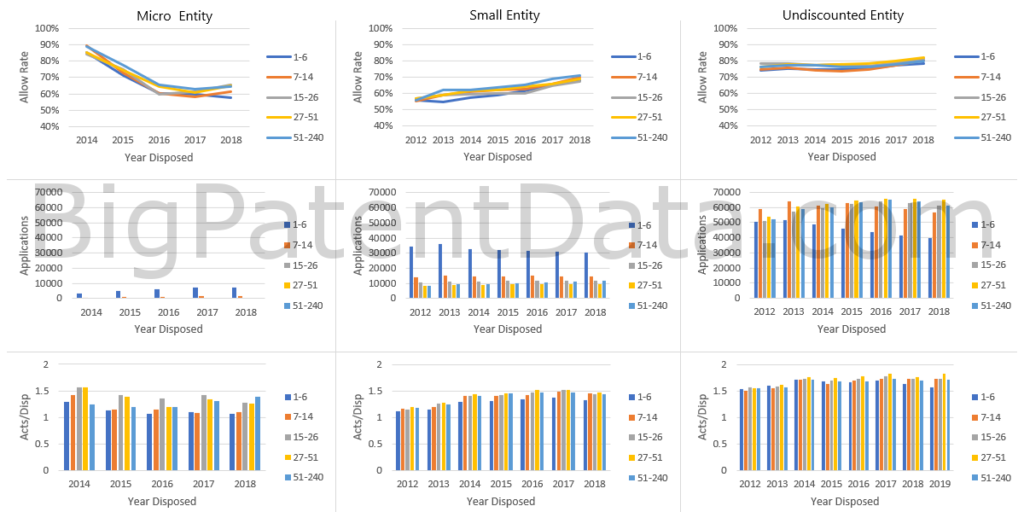
Following up on last week’s look at where registered patent practitioners are working, this week I looked at some high-level prosecution statistics broken out by firm/business size and applicant size.
In the graph below, each column of graphs corresponds to one of the three entity sizes that the USPTO tracks. The rows then show: allowance rate by year, applications disposed by year, and actions per disposition by year. Each graph splits these metrics into 5 cohorts corresponding to the number of registered practitioners at the firm/business currently listed in PAIR for the application.

Here are a few things I noticed looking at this chart
Avg. allowance rate depends much more on applicant size than firm size
In the first row of graphs, all 5 cohorts are pretty tightly grouped (the difference among them may or may not be statistically significant), but you can see that, for 2018, micro entities have allowance rates between 58% and 65%, small entities between 69% and 71%, and undiscounted between 80% and 82%. As Iv’e said before, if the goal is simply getting patents, then more money is better. BUT, remember that allowance rate is overrated – it says nothing about whether the patents obtained were worth the time or money spent obtaining them.
Small companies tend to use small firms, but big companies spread it around
Looking at the second row, micro entities overwhelmingly use small firms. Small entities also significantly favor small firms. Undiscounted filers use firms of all sizes.
But small firms seem to be getting less big client work
Looking at the chart in the bottom right corner, firms with 1-6 registered practitioners seem to be trending down among undiscounted filers. Maybe a function of firm consolidation? Or maybe the slight dip in filings is coming mostly out of the dockets of small firms?
I actually expected the opposite trend given the price pressures of patent prosecution. Are big firms charging less on prosecution work these days (maybe as a loss leader for litigation and/or PTAB work)? Are undiscounted entities increasing budgets in the hopes that spending more money will get them more ROI on their patent spend? (are they actually starting to measure ROI on their patent spend?)
Also, important to keep in mind is that “big client” here refers to size of the company, not necessarily size of their patent budget (although I expect them to be positively correlated). A big company that only files a few patents a year is certainly very different than IBM, but here they are lumped together. (In the future I should do a breakdown by number of applications filed rather than entity size).
On average, firms of all sizes are . . . average
Yup, the average solo practitioner has the basically the same average allowance rate and actions per allowance as the average big law firm.
Now, what I didn’t show here is that the standard deviations of these (overly simplified) metrics decrease with firm size (even adjusting for applications per registered practitioner). The way I look at it is this: on average, a big firm is more likely to get you average results, a small firm is more likely to be much worse . . . or much better.
Of course, a (huge) caveat here is that I am assuming a correlation between firm quality on one hand and allowance rates and actions per allowance on the other. There may be no such correlation (I would be very surprised if there was no correlation, but still).
But this all just goes to the fact that you have to do the due diligence when choosing a patent firm. I know you want to send work to your buddies, or a “big name” firm, or the one that gave the best pitch, but you have to work harder than that. Check their stats (against benchmarks that matter to your business and that are in line with your patent strategy), lookup their work product (don’t rely on cherry-picked ones they sent to you), call their former and existing clients (not cherry-picked references). In other words, treat it like its really important, because if its not really important, you probably don’t need to be filing patents anyways.

