

For those of you that haven’t checked out BigPatentData examiner analytics in a while, a little while back I added strategy-specific allowance rates. These are similar to comparative allowance rates that used to be found on Examiner Ninja (Aside: I was just now surprised to find that there is no “pouring one out” emoji), but with the important addition of disposition data so you know the sample size you are dealing with (100% allowance rate with an appeal brief is not that persuasive if we are talking 1 appeal brief). It looks like this:
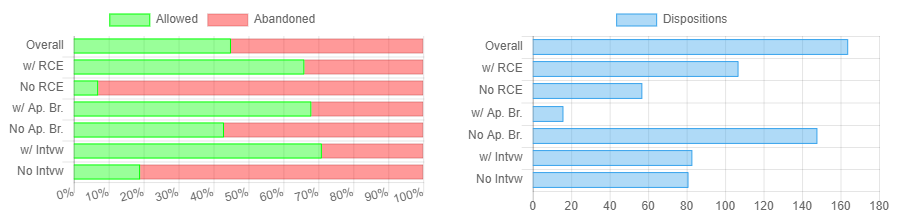
So, as an example, this examiner has allowed 66% of 107 applications for which an RCE was filed, and allowed only 7% of 57 applications which did not have an RCE. Now, obviously most examiners do not exhibit such a wide spread in allowance rates with vs. without an RCE. I cherry-picked a ringer here because it is this metric, which I will call “RCE allowance rate differential,” that I want to explore today. (On a related note, I previously looked at allowance rate vs number of RCEs here and here. You can also see the record for most RCEs here.)
Distribution of Examiner RCE allowance rate differentials
Here’s the distribution of examiner RCE allowance rate differentials (after removing examiners in the bottom 25% in terms of number of dispositions with and without RCE):
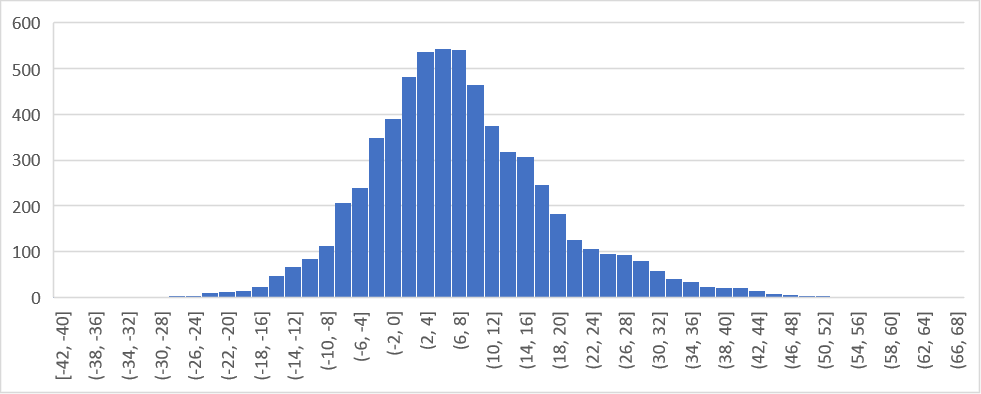
So the average examiner has a slightly (about 5%) higher allowance rate with RCE than without. This seems completely rational if you assume most RCEs are accompanied by some claim amendments. But it is usually not the “average” examiner with which I am concerned. Rather I am usually concerned with whether I am dealing with an outlier. As you can see by the relatively long tails on the graph above, there are some examiners that vary wildly from this average (like the one I showed above).
RCE allowance rate differential vs. examiner overall allowance rate
In the scatter plot below, each dot corresponds to a particular examiner’s overall allowance rate and his/her RCE allowance rate differential.
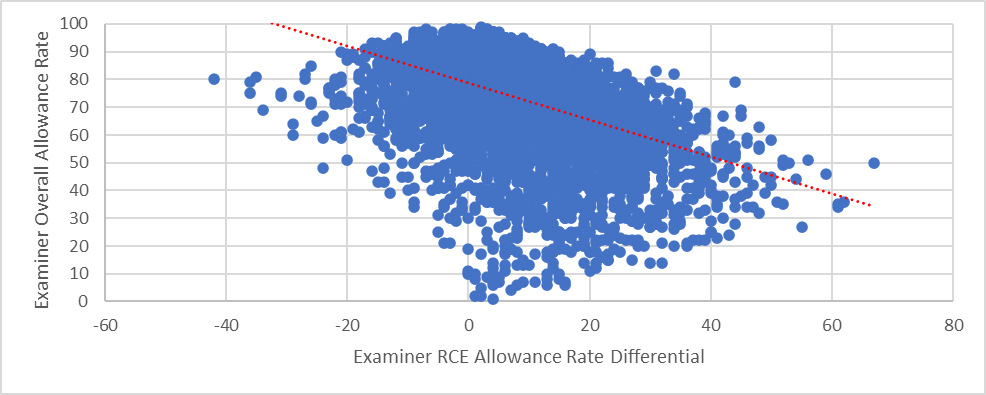
As you can see by the trend line, RCE allowance rate differential is moderately negatively correlated with allowance rate (correlation coefficient -0.4). That is, lower allowance rate is moderately associated with more bang for your RCE buck.
But that moderate correlation leaves room for a lot of variance even among examiners having similar overall allowance rates. As a random example, one examiner with a 80% allowance rate has an RCE allowance rate differential of -42 (84% without and 42% with), but another examiner with a 79% allowance rate has an RCE allowance rate differential of +44 (51% without and 95% with). So in the case of the latter examiner, it sure seems like a “pay to play” scenario where you get your patent in exchange for the examiner getting those RCE points. In the case of the former examiner, however, you might want to think long and hard about whether you truly have something patentable on your hands before filing that RCE.
So next time you are pondering filing an RCE give BigPatentData examiner analytics. I’ll even throw you a free premium report if you subscribe to the blog and then email me.