

For us patent prosecutors, whether to file an appeal brief or an RCE is a decision we have to make more often than soup or the salad.
Often the choice of whether to appeal or file an RCE is obvious. For example, an Appeal is the obvious choice when: (1) it is painfully clear that the Examiner is not going to be receptive to further arguments; and (2) you and your client are pretty confident that further amendments are the difference between a valuable patent and an expensive kindling for your fireplace.
Other times, the choice of appeal or RCE is not so obvious. This is often the case, for example, early in the life cycle of a new technology where the value of the patent is speculative in the first place and it is not clear whether additional amendments would be impact the value of the patent. These murkier situations are where examiner statistics really shine to help inform the decision so that it is not entirely based on “gut instinct” and the particular practitioner’s preferences (e.g., the practitioner loves/hates to appeal and so defaults to his/her preference 9 times out of 10).
Importantly, I am not saying the data is a replacement for the human element. I am saying that the two should work together in a system of checks and balances. For example, insights gained during an examiner interview into the Examiner’s attitude toward this particular application are very important information not found in the data. But its also common that interactions with the Examiner tell you (either explicitly or through subtext/nonverbal clues) she will do one thing, but her track record suggests a strong likelihood she will do the other. In any event, by explicitly considering the human intangibles alongside the data, the ultimate decision is more likely to be objectively justified toward the goal of optimizing the client’s ROI.
I will stop rambling and get to the data, but first a note that the charts below consider applications disposed within the last 3 years. The appeal brief charts consider the subset of those application having 0, 1, 2, or 3 appeal briefs and no RCEs. The RCE charts consider the subset of those application having up to 5 RCEs and no appeal briefs. Thus, nothing below considers applications which have some mix of Appeals and RCEs. I will get to those in a future post.
Allowance Rate
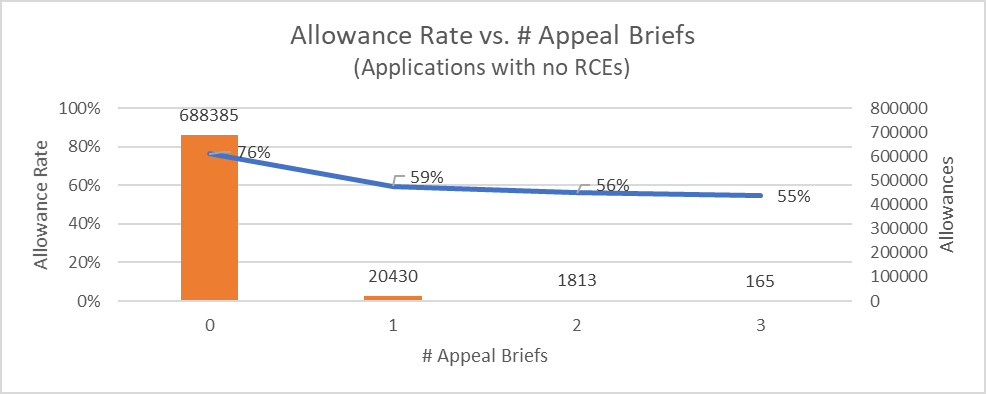
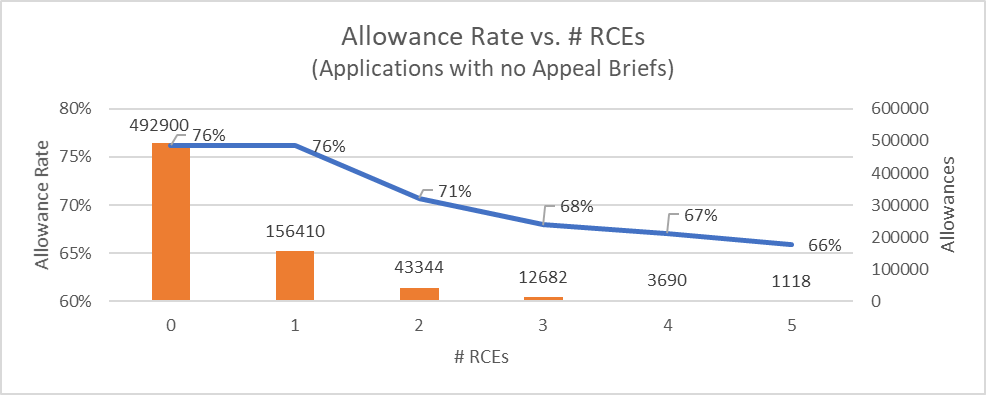
In these first two charts, the lines represent allowance rate and the columns represent number of allowances. Please note that the sample sizes get very small very quick, which is why I limited the graphs to 3 appeal briefs and 4 RCEs. In fact, I am not even sure the numbers for 2 appeal briefs or 3 RCEs are statistically significant, which is why I will focus mostly on the first appeal brief and the first RCE.
As you can see, a first appeal brief is associated with a 17% drop in allowance rate whereas a first RCE is associated with no drop in allowance rate. I think this makes intuitive sense as we tend to appeal on closer / tougher applications where as we file RCEs on applications which just need a little more massaging. In other words, I expect the difference in allowance rate for 1st RCE an 1st appeal brief is due almost entirely to selection bias (i.e., which applications we choose to appeal.)
I do think the fact that the allowance rate does not drop for the first RCE is a bit troublesome. If I dug into these application I would except a huge percentage of them to “throw the examiner a bone” RCEs which represent a big inefficiency (i.e., excess cost born by applicants) in the system.
Substantive Responses to Allowance
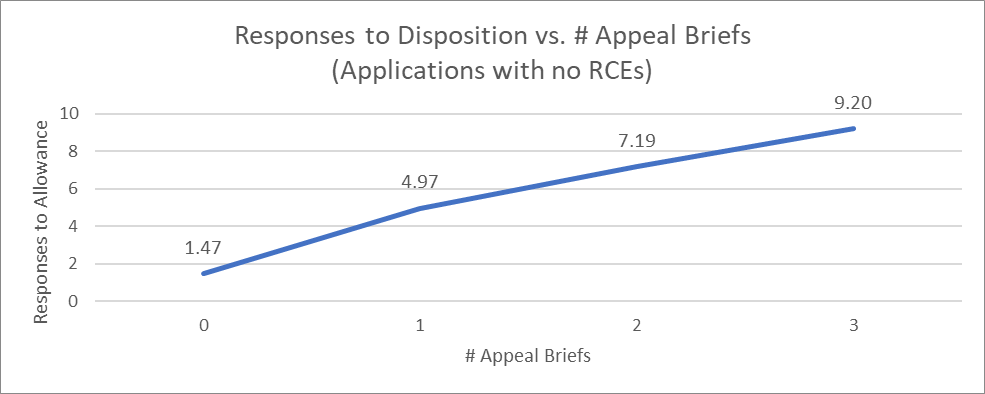
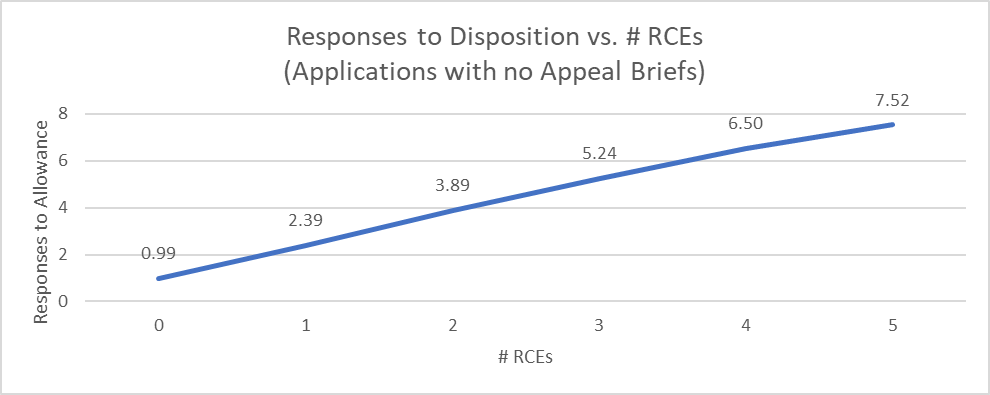
Here the lines represent the number of substantive responses (responses after nonfinal, responses after final, pre-appeal brief requests, appeal briefs, and reply briefs). The number of responses to disposition grows roughly linearly with each appeal brief or RCE, but grows faster with each appeal brief. I would expect the difference to be around 2 (i.e., the addition of the appeal brief and the reply brief vs. the RCE situation) but it is actually closer to 2.5 (possibly due to pre-appeal brief requests?).
I think these charts sum up the main reason why RCEs are so much more popular than appealing: the cost of a paying a patent attorney or agent to prepare an additional 2.5 responses probably dwarfs the cost of an RCE in most cases.
As a very interesting (at least to me) aside: The above is responses per disposition. I subsequently broke it down to responses per allowance and responses per abandonment. I expected responses per abandonment to be much higher than responses per allowance, but turns out it is not. Responses per abandonment was pretty consistently about 0.5 more than responses per allowance. My hypothesis is that responses per abandonment has more high-side and low-side outliers (i.e., it has greater variance) which is why the mean is not that much different. I plan on investigating this in a future post.
Time to Allowance
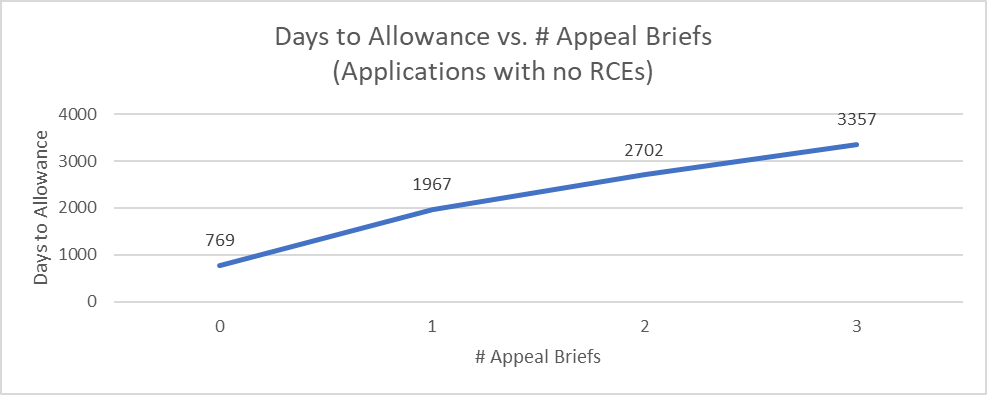
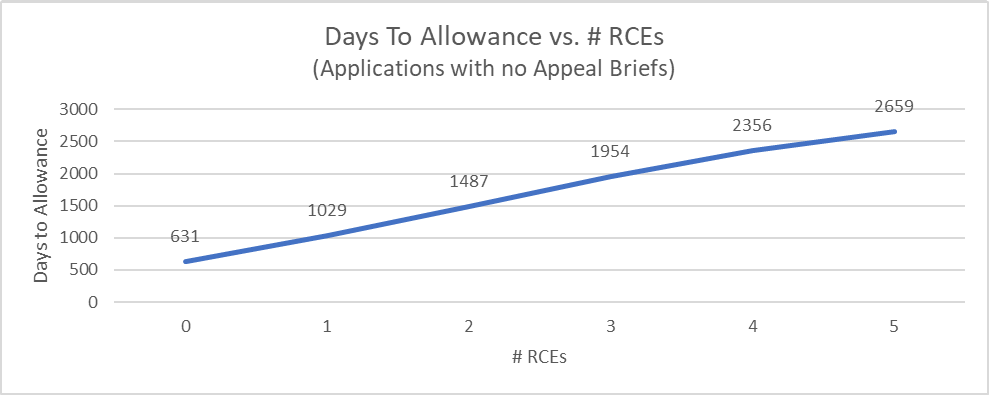
As expected Appeal is much slower than RCE — another reason RCEs are typically favored over appeals. As noted here, appeal times are coming down, so this number might have been a little closer if I just looked at the last year (instead of 3 years), but I am confident RCE is still much faster.
What to do with this information?
You may thinking “Okay, thanks for the factoids, Chad, but how does it help me decide whether to appeal or RCE in my application?” To which my response is, these PTO-wide, 3 year averages probably don’t! But, when we take a more fine-grained approach and break things down by particular metrics (e.g., (1) your examiner’s allowance rate; (2) how often your examiner answers appeal briefs; (3) how often your examiner allows an application in response to an appeal brief; and (4) how often your examiner allows an application after an RCE) then you will see how examiner statistics can help give you a little bit of additional clarity in whether RCE or appeal is the best path.
Alas, no time for that today, so go ahead and subscribe or follow BigPatentData on LinkedIn or Twitter to get notified when that happens.