
I wasn’t planning a post on pendency, but just saw some data that surprised me and thought this would be a good way to get back in the blogging saddle after missing a couple weeks.
The metric I was looking at that prompted this post was time to first action. Since the PTO does (try) to make this metric available, I headed over to the USPTO visualization center to confirm or deny what I was seeing.
After clicking to allow flash player (facepalm) I saw this:
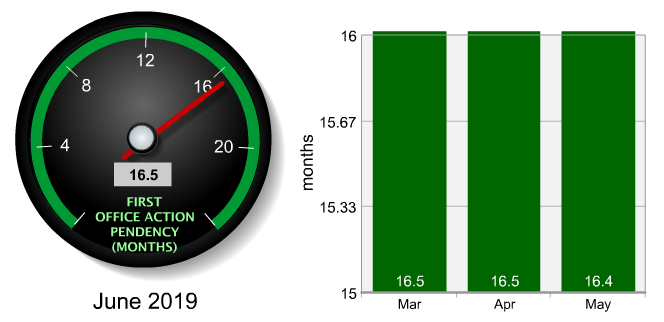
(double facepalm). The bars of this graph blowing through the roof does seems to suggest that there has been a recent increase for which the scale has not been adjusted. To confirm that the metric is on the upward trend I clicked the “view last two years” button. I am not quite sure how to read the chart that showed up on that page:

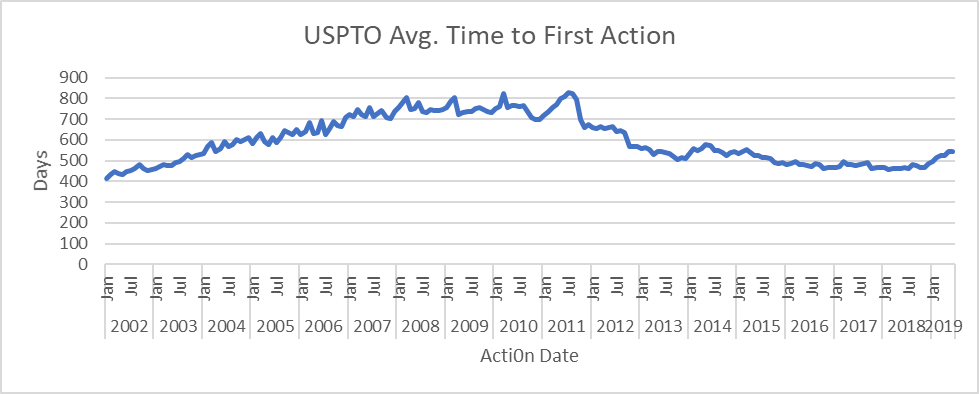
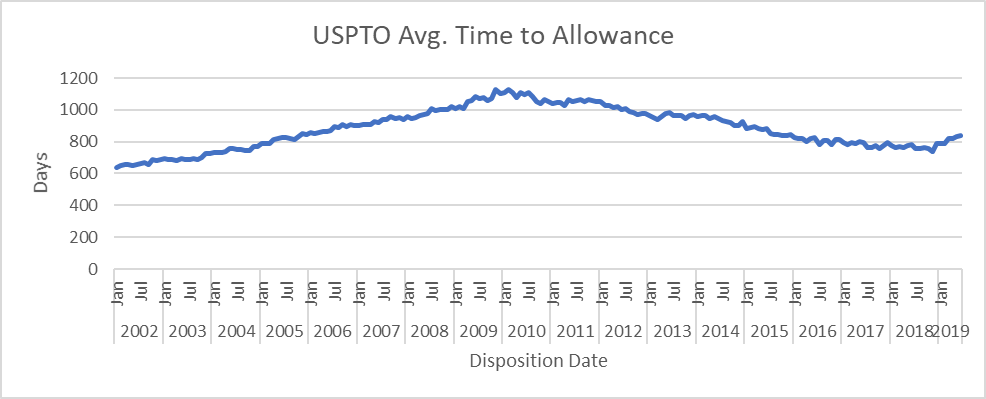
(triple facepalm). Oh well, so much for trying to get it straight from the horse’s mouth. Below are the charts showing time to first action and time to allowance. To quote the great Planes, Trains, and Automobiles, those lines are GOING THE WRONG WAY! (actually, with the availability of Track 1 for critical applications, I would be fine with longer pendencies in exchange better examination quality).