

There is a lot of talk recently about using art unit prediction in an attempt to “game the system” and avoid art units that are perceived as problematic (typically based low art unit allowance rate). The way it generally works is that some tool analyzes your claims and predicts what art unit you are likely to be assigned. You can then play with the words and phrases in your claims to try and shift the odds away from undesirable art units.
The thing to keep in mind here is that you application does not get assigned to the “average examiner” for the art unit (whom I envision as looking very much like the “reasonable person” from torts). Your application gets assigned to a real, live human being selected from what could be 20 or more examiners in any given art unit.
Lookup your examiner’s allowance rate now, for free, with BigPatentData Examiner Statistics
Variability of Examiner Allowance Rates within Art Units
Below is a visualization (if the embed below is too small, you can view it fullscreen here) showing the distribution of examiner allowance rates by art unit. I realize the visualization is a bit busy and might be off-putting to some, so let me just cut to the chase: given the set of art units that an application could reasonably fall into based on the claim language, it’s likely the variance among examiners within each of those art units is greater than the difference between the averages of those art units.
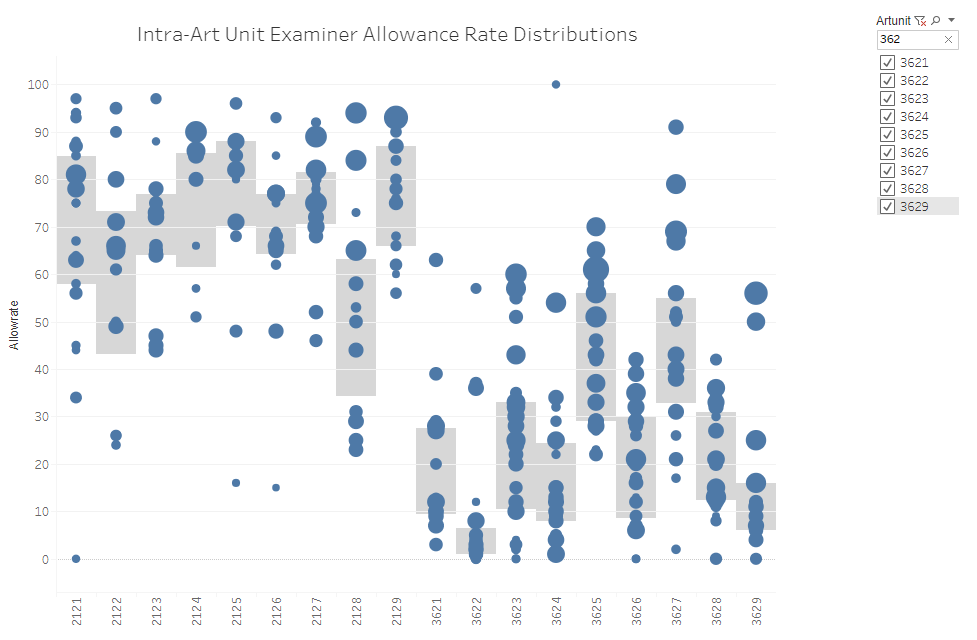
For the data diehards that want to play with the visualization, what it shows is the allowance rate for ~9000 examiner & art unit combinations (i.e., if an examiner worked in 2 art units she will appear twice). The combinations were limited to examiners who (1) have examined at least 20 applications and (2) issued at least one office action since April of 2018. The characteristics of the visualization are as follows:
- Y axis is allowance rate
- X axis is art unit
- The size of the blue dots corresponds to how many applications the examiner examined in that art unit.
- The gray box encompasses the middle 50% of allowance rates for the art unit.

By playing with the filters to show only the art units that are candidates for your application, you can see just how much overlap there is between the two sets of examiners. For example, let’s say you are preparing an application which uses “AI” to achieve some sort of business end, and the most-likely art units are 2120 or 3620. In the image below, I filtered the visualization to just show those art units*. As you can see there are a lot of examiners in 3620 that have a higher allowance rate than a lot of examiners in 2120.
So even if you end up in an art unit with a low overall allowance rate, all hope is not lost. The individual examiner is likely a much better predictor of your ultimate success. So be sure you know her preferences and tendencies. Here, let me help you with that.