

As someone who makes the bulk of his income drafting and prosecuting patents, the amount of prosecution work to go around is something I am keenly interested in. A few months ago I found that the number of new patent applications being drafted in the U.S. was down about 8% from the all-time high in 2013 and appeared to be trending downward.
Today I want to revisit that topic, and try to peer into the crystal ball and see whether the market for patent prosecution work is going to look like in the near future.
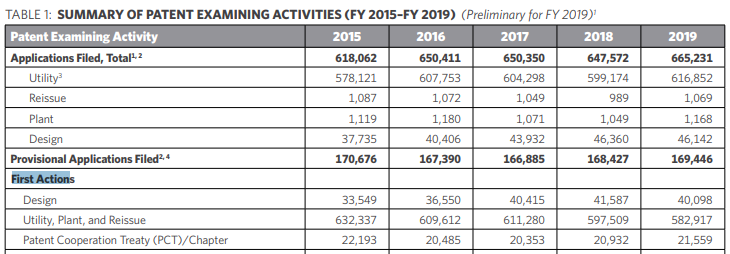
Total filings were down slightly in 2018 and up 3% in Fiscal Year 2019
According to the 2019 PAR, total filings were down slightly in 2018 and up about 3% in fiscal year 2019.
But, of course, these are total filings. I am more concerned with new U.S.-drafted applications (i.e., how much potential work is there for me).
Since the PAR doesn’t break out which applications are continuations and which claim foreign priority, I will have to use the public PAIR data. The thing that obviously makes this a bit difficult/annoying is 18 month publication. A LOT has changed in the past 18 months — particularly the USPTO’s approach to 101, and so this may be a case where “past performance is not indicative of future gains” is particularly true.
2018 is looking like it was another down year for new, U.S.-Drafted Applications
At this time last year, there were 127,698 published applications or patents filed in calendar year 2017 and meeting my criteria for new, U.S.-drafted application. Currently there are 125,414 published applications or patents filed in calendar year 2017 and meeting my criteria for new, U.S.-drafted application. So 2018 is trending 2% lower than 2017 — a little bit worse than the drop in total applications, but probably within the margin of error (especially because I used calendar year, but the PAR uses fiscal year). With roughly 1/2 of applications filed in 2018 having reached 18-month publication, this number could of course swing a lot in either direction, but I can’t think of any reason that second half of 2018 would have diverged wildly from the first half.
2019 may have been a turn around year
At this time last year, there were 40,551 published applications or patents filed in calendar year 2018 and meeting my criteria for new, U.S.-drafted applications. Currently there are 48,669 published applications or patents filed in calendar year 2019 and meeting my criteria for U.S.-drafted applications. So 2019 is trending 20% higher than 2018. Since we have not hit 18-month publication for any applications filed in 2019, this 20% is obviously a very sketchy number (especially comparing it to the 3% increase in total applications reported in the PAR). Higher allowance rates and faster allowances certainly account for some (or even all) of it. But, early in 2019 is when we saw the USPTO do a major about face on 101, and I would not be surprised if that triggered a large spike in new U.S.-drafted filings. So for patent prosecutors, this is a positive sign.
Other data also suggests filings are continuing to rise
As noted, the 2019 PAR is for fiscal year 2019 and thus does not include Q4 of calendar year 2019. The USPTO visualization center (yes, it is still flash based and, yes, several of the charts have not worked for a long time ), does however have some data for that time period.
The unexamined application backlog chart shows that the backlog grew steadily in Q4 and in fact reached its highest level since at least October 2016. This is despite pendency basically staying the same (or even dropping a bit). It’s also despite there being slightly more examiners in 2019 than 2018 according to the 2019 PAR.
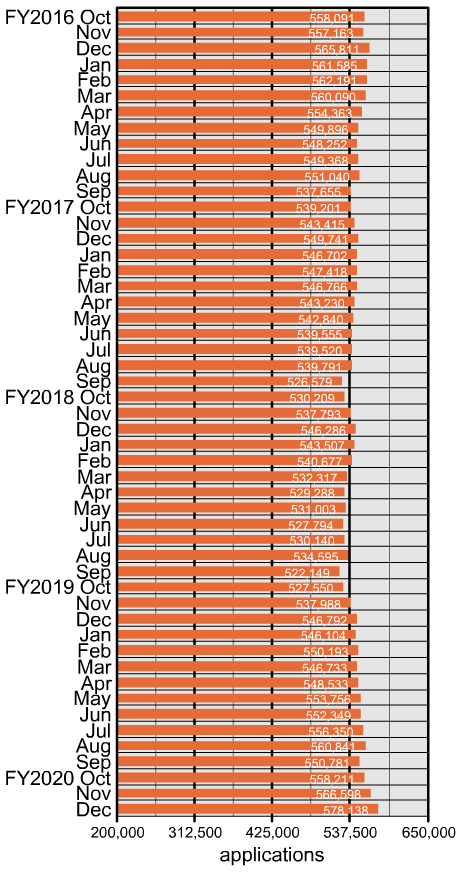
Like the PAR this backlog data does not distinguish new, U.S.-drafted applications, but if total applications are continuing to grow, then that bodes well for continued growth in new, U.S.-drafted applications.
Prosecution Trends
Obviously new application prep is only part of the workload. What about pros?
The PAR (see table above) shows that first actions have dropped about 8% in the past 5 years (from 632,337 to 582,917. This is probably due to an increased number of first action allowances. If first actions dropped by that amount, then final actions almost necessarily dropped by more (again, considering the trends of higher allowance rates and lower actions to allowance).
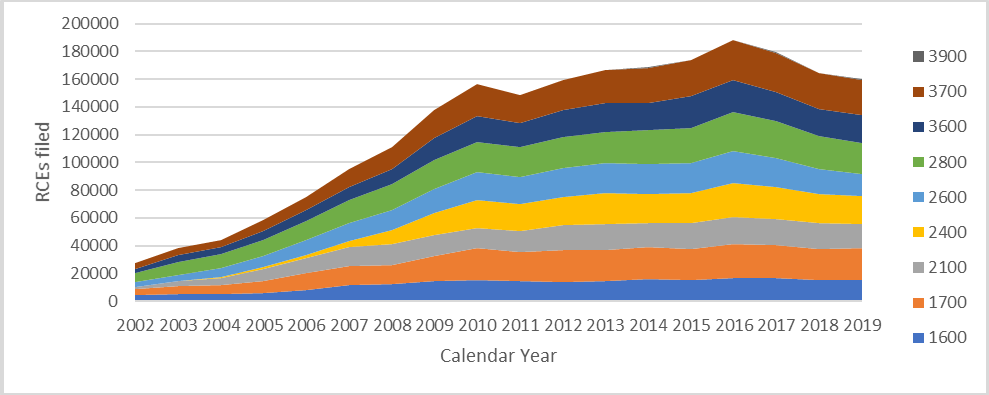
The PAR doesn’t give any good details on RCEs, so here again I went to the public PAIR data which shows RCEs in 2018 being down about 5% from 2017, and 2019 trending slightly below 2018 levels. Again, this all makes sense in light of the recent higher allowance rates and lower actions to allowance.
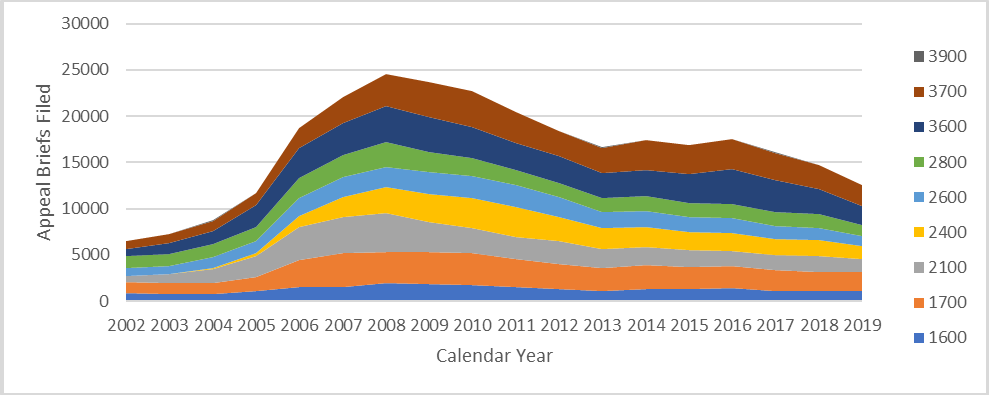
As for Appeal briefs, they appear to be continuing their long , slow decline after a meteoric rise in the Dudas years. Appeal briefs in 2018 were down about 5% from 2017 and are trending down more than 14% in 2019 as compared to 2018. Even though this is very preliminary data, I expect the final tally will reflect a big drop in ex parte appeals in 2019 due to the PTO’s new approach to 101.
Conclusion
Total prep and pros work has probably been slightly down overall the past few years. This is likely due partly to a drop in filings when the Alice hit the fan, and partly due to prosecution becoming more efficient. It does appear new filings are on the upswing, but that prep work may only offset the decline in pros work, so I don’t think we can expect the pie to get substantially bigger anytime soon. Better start thinking of innovative ways to grow your piece of it.