

“How often do patent applications get rejected?” This is probably one of the most common questions I get asked from clients unfamiliar with the patent process. So I figured it’s about time for a post that directly answers the question.
Looking at disposed (allowed or abandoned) applications filed since 2009, I broke down the numbers by disposition, type of rejection (final and non-final), filing year, and technology center.
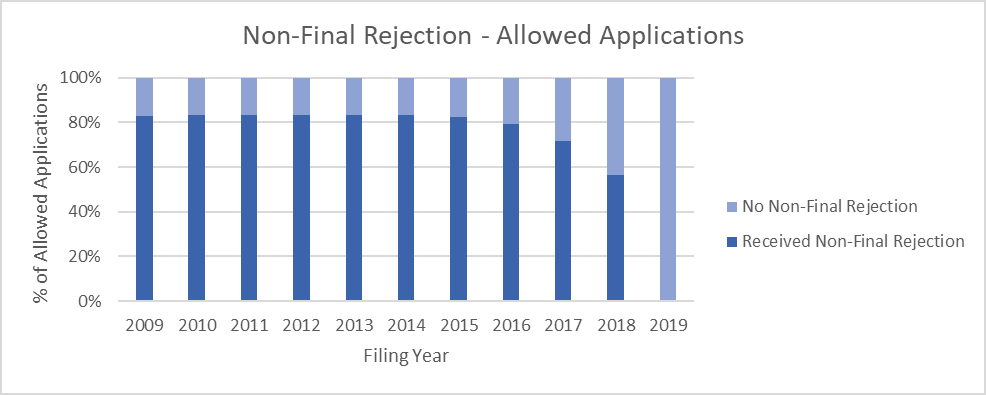
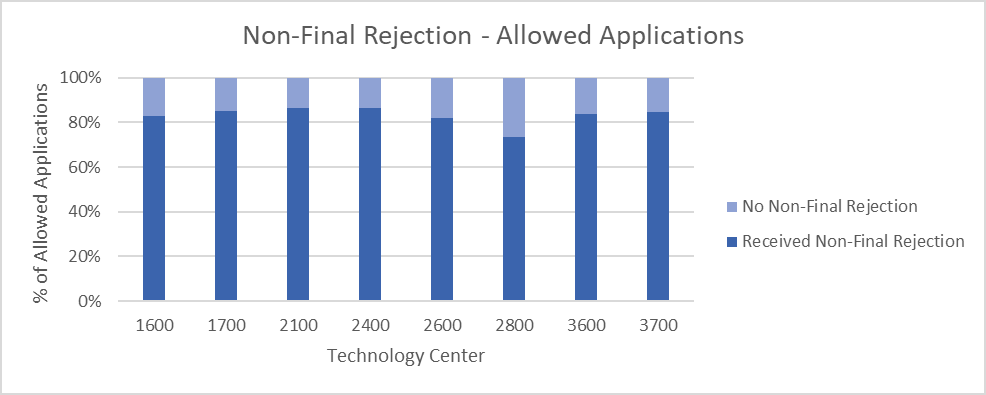
About 80% of Allowed Applications Receive at least 1 Non-Final Rejection
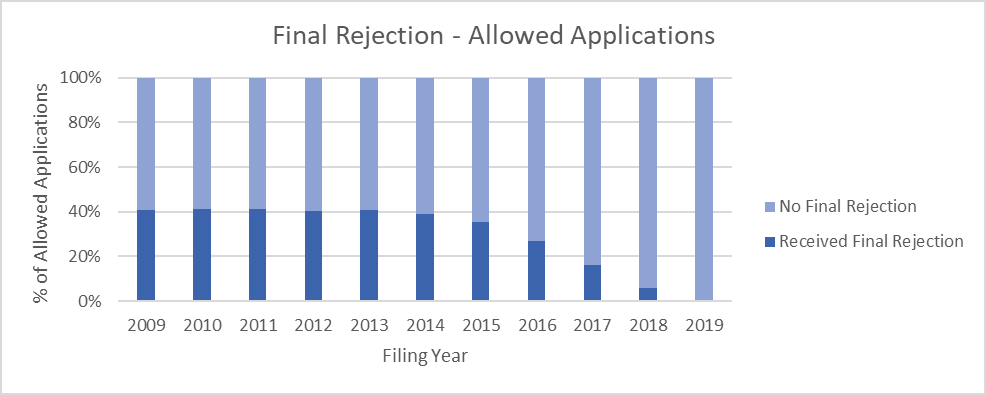
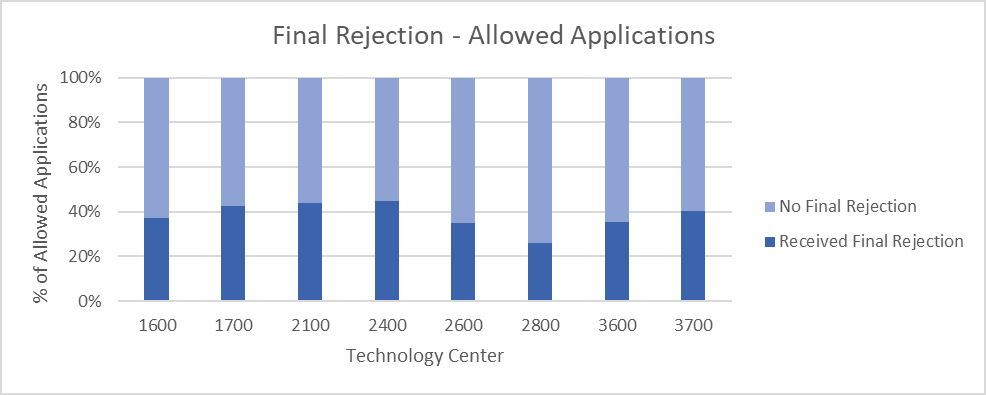
About 40% of Allowed Applications Receive at least 1 Final Rejection
So if you are an inventor that found this article in a panicked Google search after getting a rejection or a (gasp!) final rejection, rest assured that all is not lost — especially if it is your examiner’s m.o is to always issue a few rejections but then inevitably allow the application (i.e., high actions to allowance and high allowance rate). So look at the merits of the rejection and check your examiner’s m.o. using BigPatentData Examiner statistics, before deciding whether to panic or not.
Over 90% of Abandoned Applications Receive at least 1 Non-Final Rejection
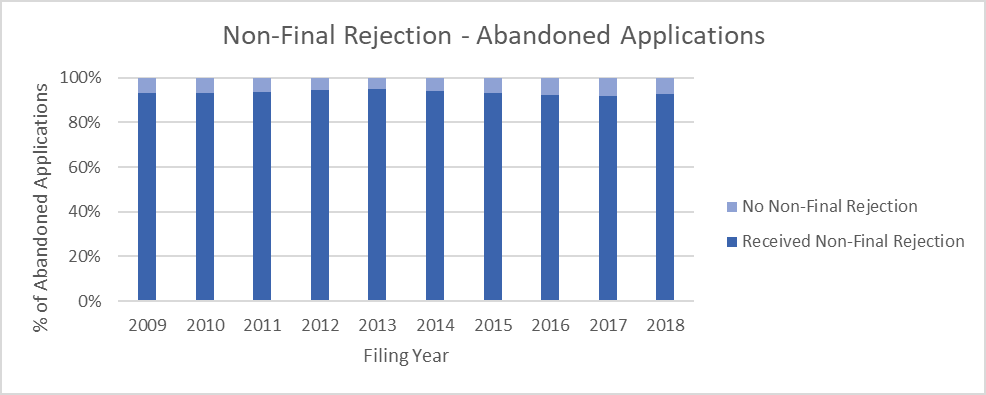
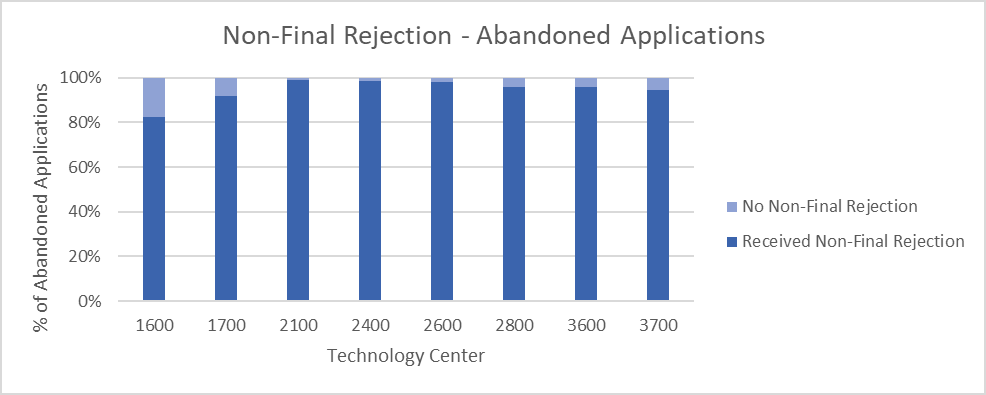
Important context for the above charts is that I ignore abandonments during pre-examination. Thus, all of these applications paid their filing fees. So why do 5% to 10% of them go abandoned without ever receiving an action on the merits? And why on earth is that number 20% for TC 1600!?
It appears the answer is that a lot of applications are abandoned after receiving only a restriction requirement1. In fact, if you compare this chart with the third chart in Are You Prosecuting Patents in Restriction Hell?, you will see the technology centers with more restrictions are the ones with more abandonments without a non-final rejection.
Only About 50% of Abandoned Applications Receive at least 1 Final Rejection
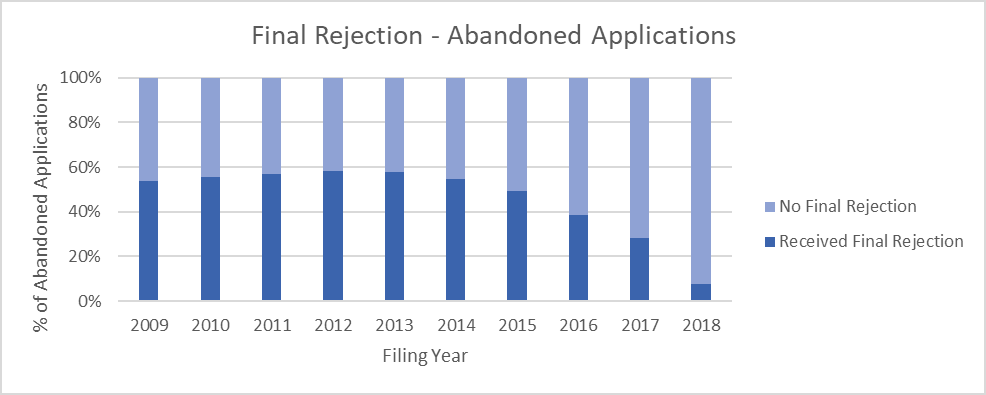
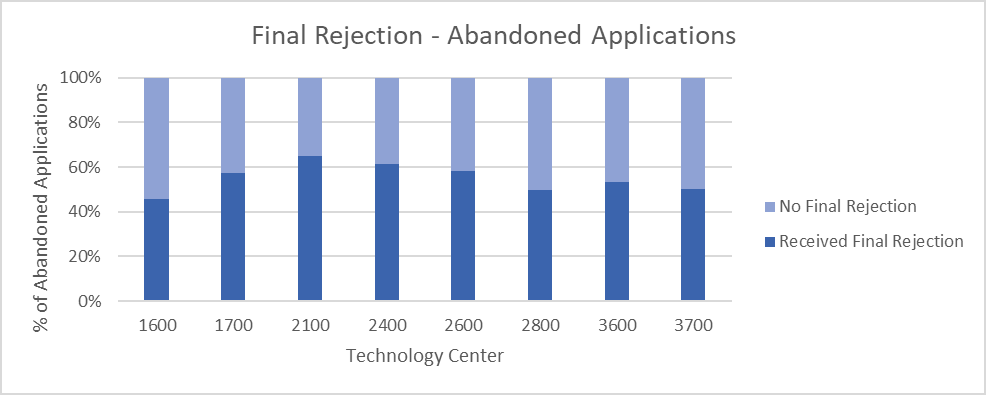
That roughly 50% percent of applications go abandoned without ever receiving a final rejection was also higher than I expected. And it only got more surprising when broken it down by entity size. As discussed in Does Size Matter, small and micro entities tend to abandon applications sooner than large (“undiscounted”) entities. Looking at 2014, about 40% of undiscounted applications went abandoned without receiving a final rejection. That number was 55% for small entities and 57% for micro entities.
So there you go. Now you have an answer next time someone asks you how often applications get rejected. If you find it useful, you can thank me by subscribing.
1 Why one would abandon an application in the face of only a restriction is not clear to me. Anyone want to enlighten me? I suppose one situation may be where the application is a continuation and the restriction would effectively result in claims already covered by a parent or other co-pending application?