

Update Feb 28, 2019: The allowance rates were in fact probably not this high. I failed basic patent law history as explained here.
This week I was halfway through a post exploring continuing applications vs. non-continuing applications (which I will get to soon), when I hit a snag. Specifically, I was plotting allowance rate by filing year and got this:
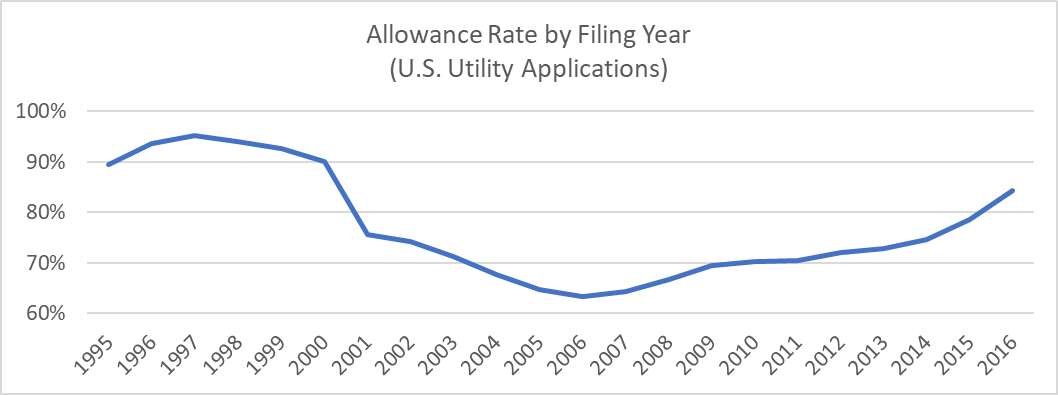
I immediately thought it could not be right. Although the numbers in more-recent years align with what I have previously come up with (e.g., here), surely there is something wrong with those pre-2001 numbers?
The short answer is that I am pretty sure they are right. For the gory details of why I think they are right, you can keep reading below. But to bring it back around to the overly-dramatic title of this post, I think there is a good argument to be made that those absurdly-high allowance rates during the first dotcom boom are the root cause of the current patent eligibility dumpster fire.
With allowance rates that high during the first dotcom boom, certainly there were a lot of garbage patents issued. But in our efforts to get rid of those patents as cheaply as possible, we threw out the baby with the bathwater. By 2001 the patent office was already getting its act together in terms of more-thoroughly examining the new technologies of the age. We should have just stayed the course and allowed the glut of “bad patents” to expire and be killed on traditional 102, 103, and 112 grounds. Sure killing patents on 102, 103, and 112 is probably more expensive than killing them under the new 101 (yes, I say “new”), but it beats the current double whammy of 101 being a total mess AND allowance rates again creeping into the stratosphere!
Why I think those allowance rates are right
Here is the data behind the allowance rate calculation:
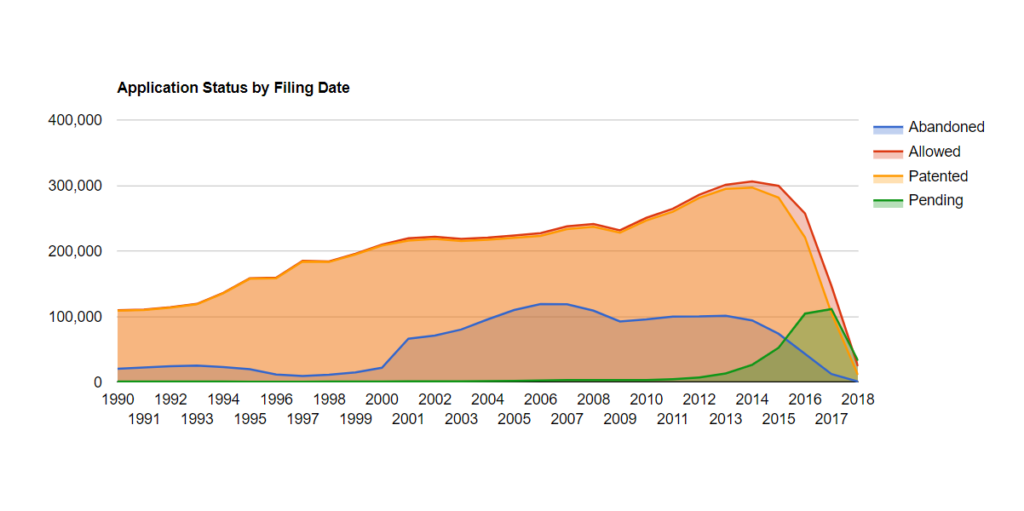
In last week’s post Lies, Damned Lies, and Examiner Statistics, I discussed how I calculate allowance rate based on allowances and not based on issued patents. Thus, I “Patented” in the chart above only as a sanity check on my “Allowed” count. The fact that the Allowed line and Patented line closely follow each other gives me pretty high confidence that my Allowed number is correct.
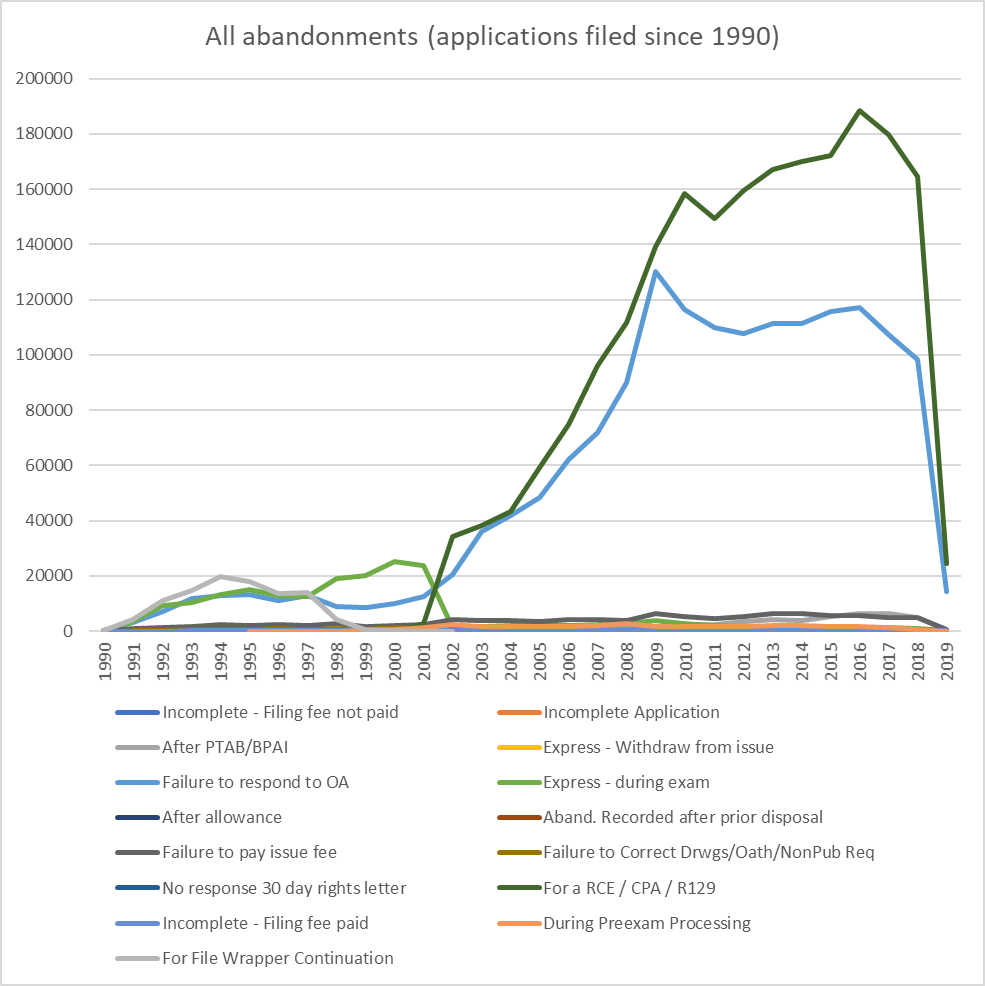
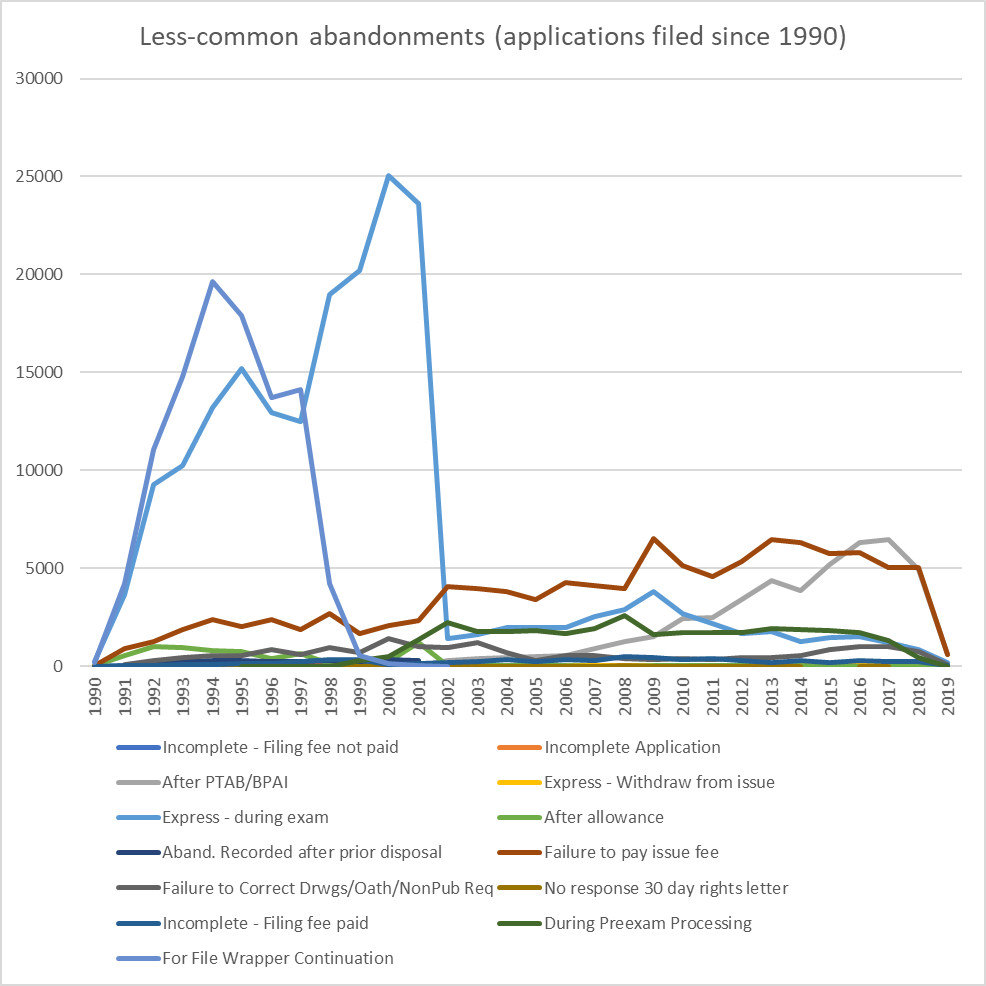
As for my abandoned number, as discussed last week, PAIR has many different categories of abandonments and I only count some of them as actually being abandonments. Looking at the chart above, the dip from 1995 to 2000 followed by sharp rise in 2001 looked a little suspicious (e.g., perhaps I was missing a type of abandonment that was used only from 1995 to 2000). A deep dive into the PAIR data revealed no smoking gun, but it did produce a chart of all abandonments for applications filed since 1990, in case you are curious:
One other possibility I considered is that PAIR is missing a bunch of abandoned applications from 1995 – 2000. The USPTO, however, reports PAIR coverage to be basically 100% for applications filed since 1981).
So finally I started Googling to see if anyone else’s data matched this. I found a paper by out of the University of Richmond from 2013 that I vaguely remember but had forgotten about. I would encourage you to check it out, but, in short, when not counting RCEs, continued prosecution applications, and file wrapper continuations, they also arrived at crazy high allowance rates from 1995 to 2000 followed by a sharp decline in 2001.