

In last week’s post I listed consecutive nonfinal actions as being an indicator of low-quality examination. My perception (based on only my own anecdotal experience)was that consecutive nonfinal actions seemed to happen when the first action was sloppy and thus did not really help to advance prosecution. I therefore expected that more consecutive nonfinal actions would correlate with higher numbers of actions to allowance and longer times to allowance (i.e., wasting the applicant’s time and money). But alas my perception is again not supported by the data (see here for another example). Very surprisingly to me, the percentage of an examiner’s nonfinal rejections where the previous action was also a nonfinal rejection (i.e., the percentage which are consecutive nonfinal rejections), is not strongly correlated with, well, with anything.
Examiner allowance Rate vs. Consecutive Nonfinal Actions
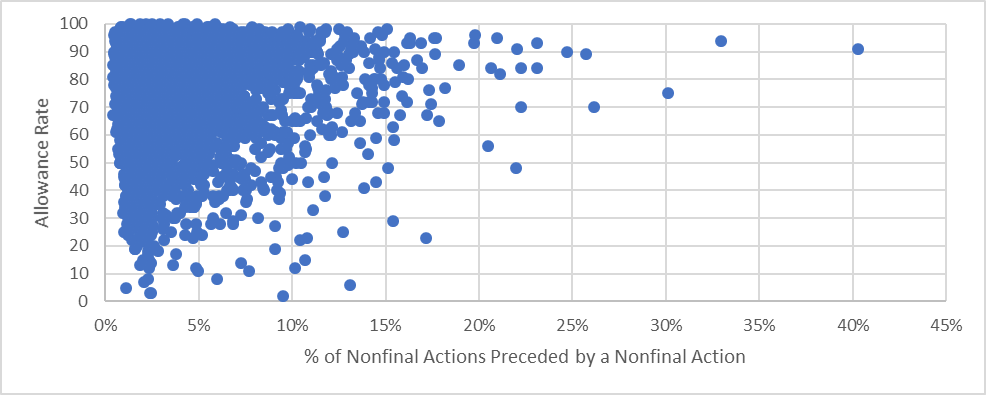
The chart below shows examiner allowance rate vs. percentage of the examiner’s nonfinal rejections which are consecutive nonfinal rejections. There is basically no correlation (coefficient = 0.02)
Examiner Actions per Allowance vs. Consecutive Nonfinal Actions
The chart below shows examiner average number of actions per allowance vs. percentage of the examiner’s nonfinal rejections which are consecutive nonfinal rejections. Again there is basically no correlation (coefficient = 0.03)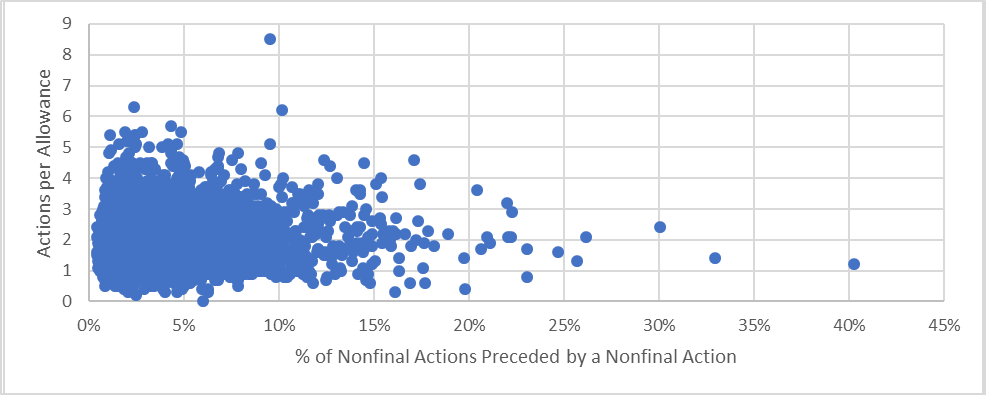
Examiner Time to Allowance vs. Consecutive Nonfinal Actions
The chart below shows examiner average months to allowance vs. percentage of the examiner’s nonfinal rejections which are consecutive nonfinal rejections. Again there is basically no correlation (coefficient = 0.02)
Other Metrics vs. Consecutive Nonfinal Actions
I’ll spare you a bunch more scatter plots that just look like uninteresting blobs, but here are some other metrics I checked for correlation with consecutive nonfinal rejections:
| Metric | Correlation with Consecutive Nonfinal |
|---|---|
| Response after final results in allowance | 0.06 |
| Response after final results in RCE | -0.12 |
| Response after final results in appeal brief | -0.04 |
| # of pre-appeal brief requests | -0.06 |
| Pre-appeal decision = withdrawn | 0.02 |
| Pre-appeal decision = reopen | 0.03 |
| Pre-appeal decision = Proceed to board | -0.09 |
| # of appeal briefs filed | -0.03 |
| Appeal brief results in allowance | 0.03 |
| Appeal brief results in an answer | -0.12 |
| Appeal brief results in a reopening | 0.11 |
All of these correlations are directionally what I expected – basically always favoring negotiation over confrontation – but the strength of the correlations are all much weaker than I expected. And, ultimately, they are all so weak that it is probably not worth paying attention to this metric.
Enjoy the “Win”
As an patent prosecutor, I always had mixed feelings about consecutive nonfinal rejections. On one hand, it always feels good to “win” an argument. But on the other hand, if you are not actually any closer to an allowance then your client’s money has effectively been wasted. The stats above tell us that, on average, a consecutive nonfinal does not really change the expected number of actions to allowance or time to allowance. That means, on average, consecutive nonfinals don’t really impact the total cost of prosecution.
So next time you get a consecutive nonfinal rejection, go ahead and enjoy that “win” a little bit more.
I think you mined an intersting stastic actually. What’s the likelihood I get an allowance if I force a second non-final? Dig deep inside the dependent claims. That’s where the mistakes are made. Force that second non-final and you might get a phone call trying to get the thing allowed.