
Eli Mazour was wondering how many examiners have not allowed any applications this year. Since he has a cool podcast (with an impressive list of past guests), and was recently interviewed in Above the Law, I decided to look into it.
Simply listing all examiners with no allowances this year would not be very satisfying. Many on the list would be new examiners who just haven’t examined many applications yet. Others on the list maybe just didn’t have many applications at a stage suitable for allowance (e.g., had many new applications and RCEs needing a fist action on the merits). So in order to decide who the candidates are for the BigPatentData 0-fer club, I decided to look at the relative number of final rejections and allowances issued so far this year.
The average examiner has issued 21.3 final rejections and 28 allowances in 2018.
The first metric I looked at is the difference between an examiner’s number of final rejections in 2018 and number of allowances in 2018. Shown below is the distribution of this metric for examiners writing at least one final rejection in 2018. (Note: I excluded Design Patents – Technology Center 2900 – because the numbers are borderline absurd, which I will probably write about in a future post).
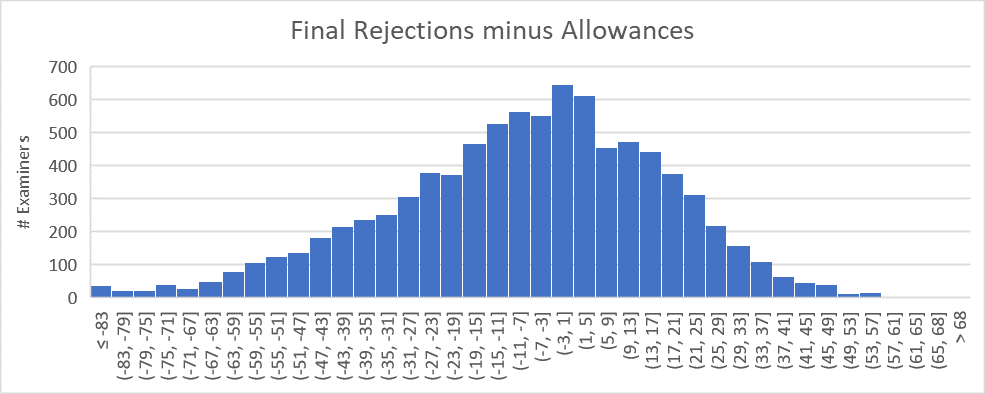
The average number of final rejections was 21.3 with a standard deviation of 13.4. The average number of allowances was 28.7 with a standard deviation of 20.2. The average difference between final rejections and allowances was -7.4 with a standard deviation of 25.2.
So using the above chart and my judicial discretion, I decided the qualifications for entrance into the prestigious BigPatentData 0’fer club would be that the examiner must have written at least 22 final rejections in 2018 (i.e., at least an average number of final rejections). This includes 60 of the over 8000 examiners who wrote at least one final rejection last year.
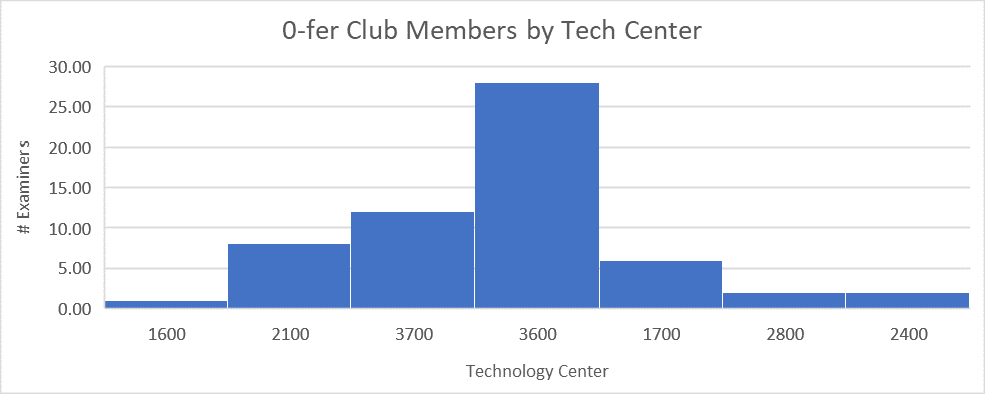
Technology Center 3600 has twice as many members of the 0-Fer Club as the next closest technology center.
I know . . . shocking, right?
Want the stats on your particular Examiner? Check out BigPatentData Examiner Statistics.
Pingback:Patent Riffs & Links for Oct 22, 2018