

Last week’s post showing the high allowance rate for applications enrolled in the first action interview pilot program (FIAP), made me wonder what the average number of actions for FIAP applications looked like as compared to applications in general. For fun, I also decided to look at that number for prioritized (“Track 1”) applications. Here are the results:
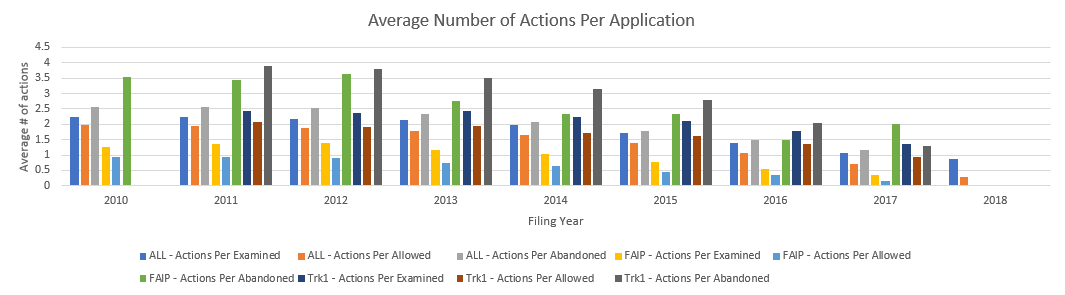
I know its a lot of bars for a single chart, but bear with me because I wanted the relative heights to be clear across the nine categories.
- Bars labeled “All” includes all utility applications filed since 2010.
- Bars labeled FAIP is a subset of “All” corresponding to applications enrolled in the FIAP program.
- Bars labeled “Trk1” is a subset of “All” corresponding to applications which were granted track 1 status prior to receiving any actions on the merits and prior to any RCEs.
- Bars labeled “per Examined” includes abandoned, allowed, and still-pending applications that have received at least one nonfinal action or a notice of allowance
- Bars labeled “per Allowed” includes only allowed applications
- Bars labeled “per Abandoned” includes only abandoned applications (abandonment for an RCE is not counted as an abandonment)
The average utility application receives 1.4 actions before allowance and 2.1 actions before abandonment
Nothing unexpected here.
Track 1 applications receive 1.6 actions per allowance vs. an 1.4 actions per allowance for all applications.
I found this result very surprising, but I will save most of my comments on this subject for a later post dedicated to the Track 1 program.
Track 1 applications receive 2.9 actions per abandonment vs. 2.1 actions per abandonment for all applications
To me this was not surprising. Because of the high cost of Track 1, I would expect that it is typically reserved for applications that are perceived to be more valuable. And that applicants will fight harder and longer for such applications. (Or is it a result of the sunk cost fallacy…?)
FAIP Applications Receive Fewer Actions Per Allowance Than the Average Application
This reinforces the point made in my previous post that this program should be used more often. But…
FAIP Applications Receive More Actions Per Abandonment Than the Average Application
This was another result I found surprising. (To be clear, I did not count pre-interview communications as actions, so the difference is not due to that). I suppose this may also be explained by applicants using the FAIP on their more-important applications?
To shed a little more light on the differences in numbers of actions, I plotted average number of RCEs:
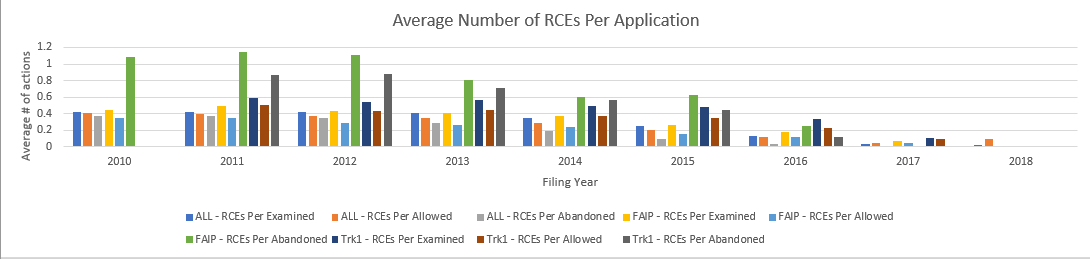
As you can see, the additional actions in FAIP and Track 1 abandonments are strongly correlated with higher numbers of RCEs in those applications (So, in the case of Track 1, it is a double whammy — the applicant has paid track 1 fees and RCE fees on top of the normal filing fees, with nothing to show for it.)
Also, as a reminder, this data is based on patents and published applications, so the numbers in more-recent years are skewed by patents issuing before their 18 month publication deadline.
Finally, at the risk of exposing my age and my television-addicted childhood, did anyone else think of the following video upon reading the title of this post?
