

This week I once again draw inspiration from PatentlyO. In this post Dennis looked at the number of inventors per application. He subsequently tweeted a followup showing more or less[1] the following plot that more inventors correlates with higher allowance rate:
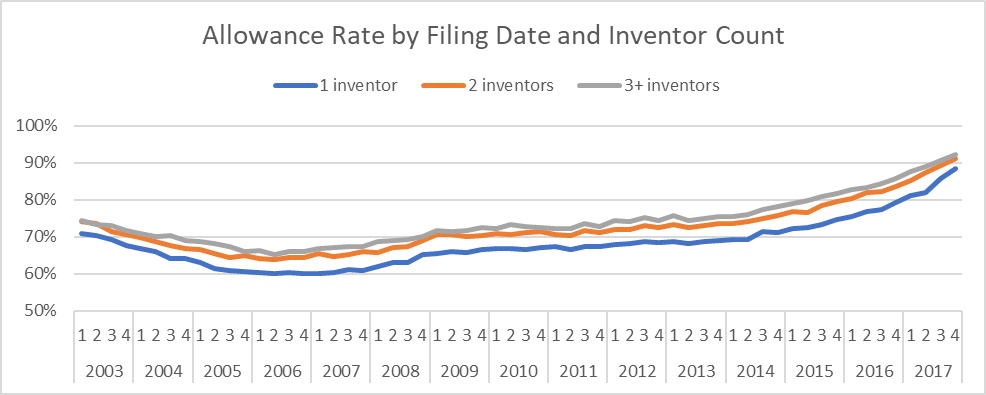
Upon seeing this, I immediately wondered what this looks like when split out by entity size (@BryanHart tweeted the same thing). Today I got around to running the numbers. Here they are:
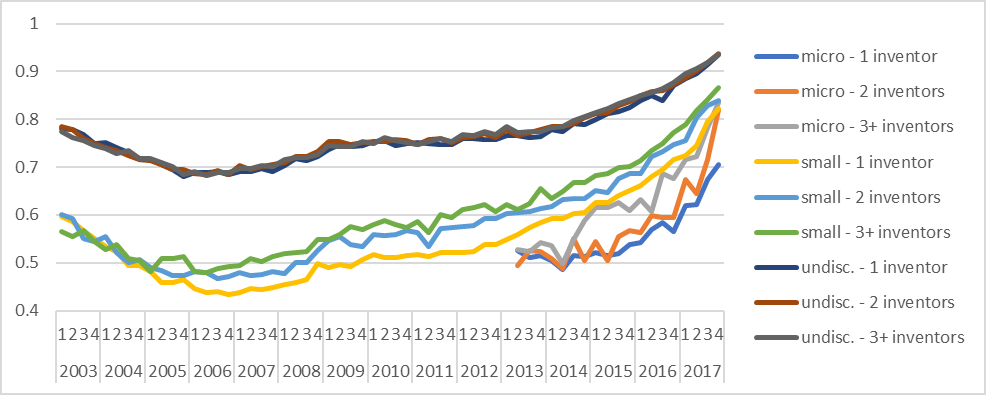
As you can see (okay, sort of see, since this quick and dirty Excel plot is not the prettiest), the allowance rate goes up as the size of the entity increases and the number of the inventors increases.
Bigger companies certainly (as a general rule) have larger patent budgets than smaller companies. I think it is also safe to assume that companies with more inventors likely have bigger patent budgets than companies with fewer inventors. If so, then this chart basically says, the bigger patent budget you have, the higher your allowance rate. (see also: Does Size Matter?, IBM vs. the USPTO, and Allowance Rates With and Without 101 Rejections)
[1] Dennis used patented / (abandoned + patented), whereas I used allowed / (abandoned + allowed), as described in Lies, Damned Lies, and Examiner Statistics)