

Patentlyo.com recently published a great article from Colleen Chien about the impact of subject matter eligibility rejections on patent prosecution. Here’s a recent analysis I did using the same data. (Update Oct 30, 2018: see today’s post for additional analysis)
101 Rejections per Office Action
Percent of Office Actions with a 101 Rejection (by Technology Center)
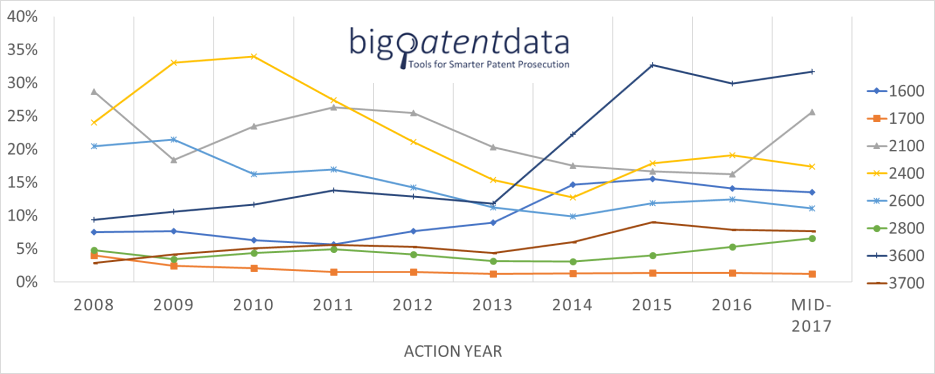
Counting the percentage of office actions is probably not the best metric because the same rejection maintained through multiple rounds of prosecution is counted multiple times. Nevertheless, one interesting thing about this chart is that most technology centers not that far above their 2008-2012 averages (TCs 1700 and 2400 are actually below their 2008-2012 averages). The other thing I find most interesting about this chart is the sharp increase for TC 2100 in 2017. This could potentially be because the dataset cuts off. Or perhaps it is the Electric Power Group effect?
Percent of Office Actions with a 101 Rejection (Most-Affected Art Unit Groups)
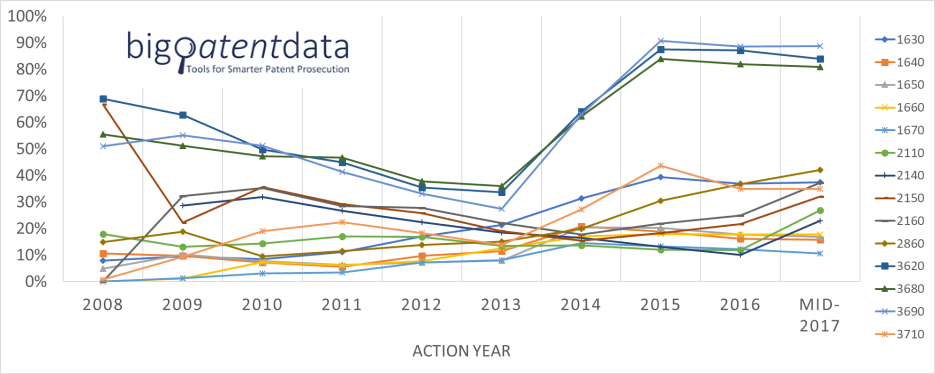
This chart narrows the focus down to the 14 art unit groups (defined by the first 3 digits of an art unit) with the highest rate of 101 rejections. Observations:
- Art Unit Groups 3690, 3620, and 3680 went absolutely bananas after Alice.
- From 2012 to 2016, art unit groups 2860, 1630, 3710 went up about 20% while the other most-affect art unit groups went up little or were even down.
- Many art unit groups previously unaffected (relatively speaking) saw a significant jump from 2016 to 2017. Again, I’m not sure if it is incomplete data or Electric Power Group. (Hopefully the USPTO will do an annual update the office actions data set, if not, a similar analysis will be high on my list of to-do items for 2019)
Percentage of Applications With at Least One 101 Rejection
To get a better sense of the impact of Alice and Mayo at the application level rather than office action level, I plotted the percentage of applications having at least one 101 rejection in their file history.
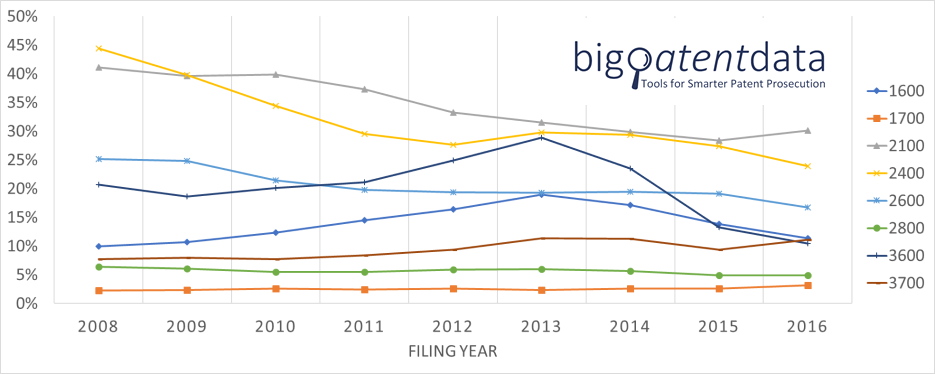
Percent of Applications With at Least One 101 Rejection (by Technology Center)
Percent of Applications With at Least One 101 Rejection (Most-Affected Art Unit Groups)
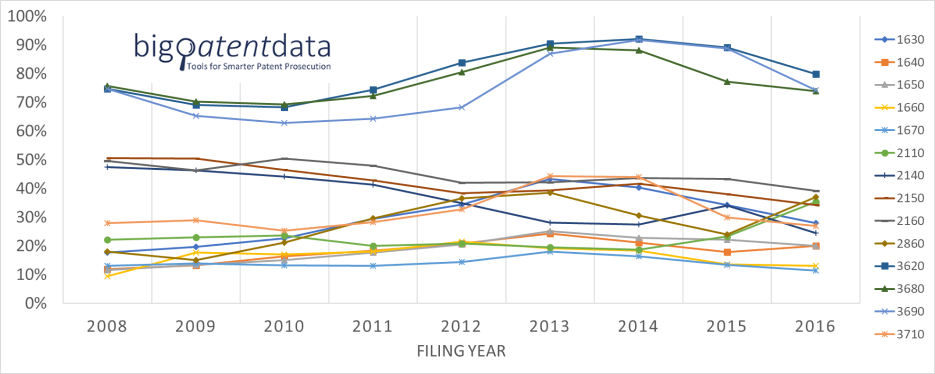
The two graphs above show a result that may surprise some: the number of applications with a 101 rejection was flat or falling from 2013 to 2015. My interpretation of this is that we simply learned to draft around Mayo and Alice. I see this as the same old story as pretty much every other major change in patent law over the past decade: (1) The courts issue a decision changing the law (despite claiming it is not a change); (2) We figure out how to draft around that decision; (3) the circle of life goes on . . . except of course for the applicants that had the bad luck of not possessing a crystal ball when they filed their application before the law changed. Even for those unfortunate souls, in many cases cleverly-drafted continuation claims can come to the rescue. The rise for applications filed in 2016 potentially throws a wrinkle in this analysis, but I am suspecting (and hoping) it is just because of the relatively small sample size of applications filed in 2016.
Allowance Rates
Allowance Rate (by Technology Center)
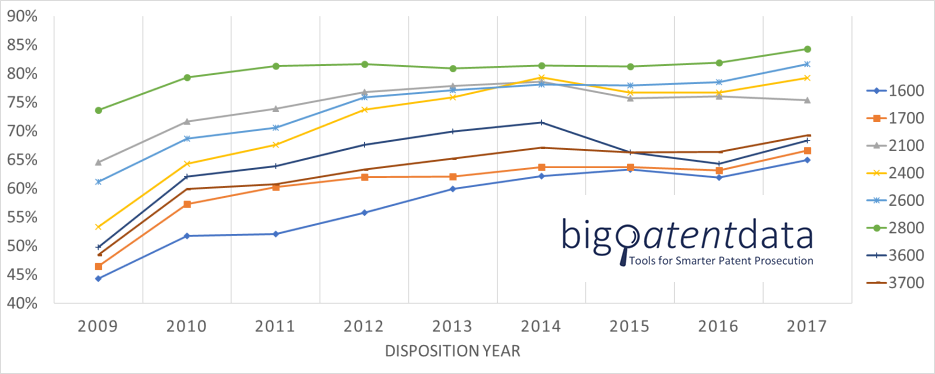
The above graph includes all disposed applications (whether or not they had a 101 rejection) and shows that overall technology center allowance rates are at or above their 2008-2012 averages.
Allowance Rate (Most-Affected Art Unit Groups)
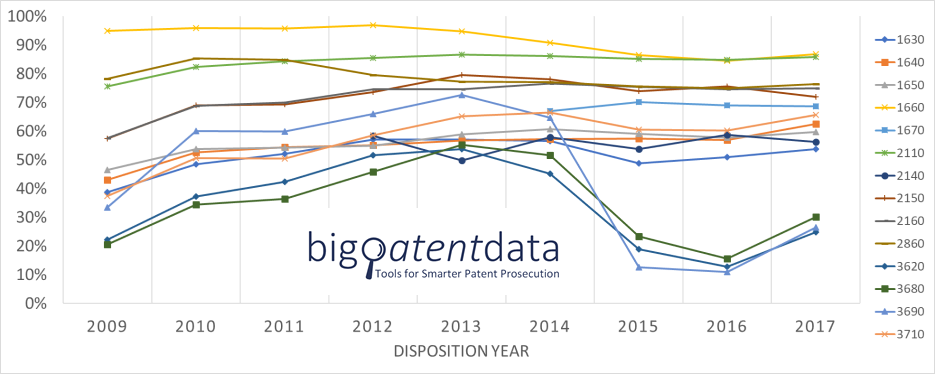
The above graph includes all disposed applications (whether or not they had a 101 rejection) and shows that, outside of art unit groups 3620, 3680, and 3690, allowance rates for art unit groups most affected by Mayo and Alice are generally at or above their 2008-2012 averages.
Status of Applications That Received a 101 Rejection
Next, to get a feeling of whether it became much harder to overcome a 101 rejection, I plotted (for 5 of the most-affect art unit groups) the status of the applications which had at least one 101 rejection at some point during prosecution.
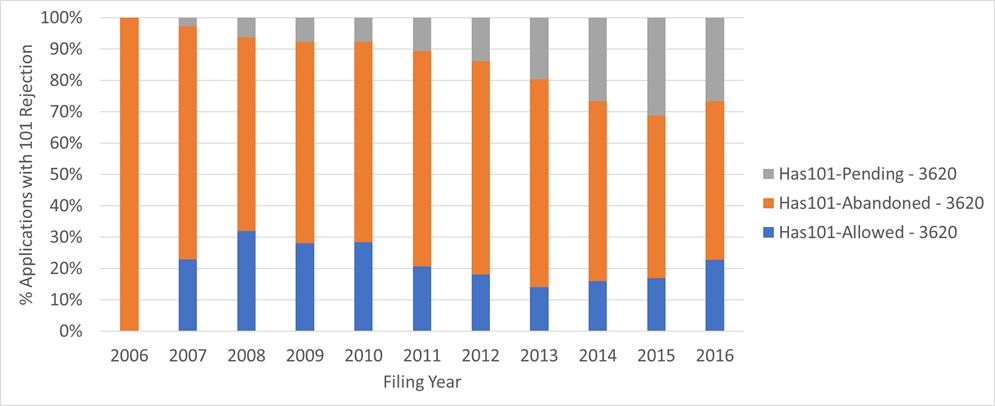
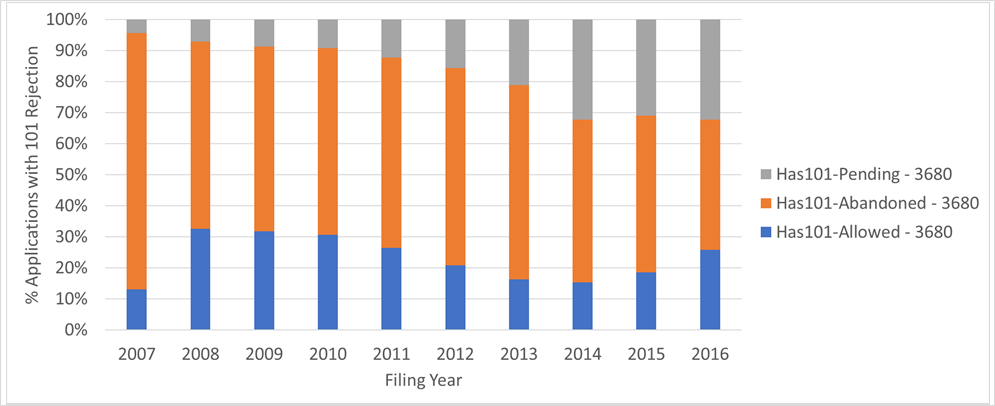
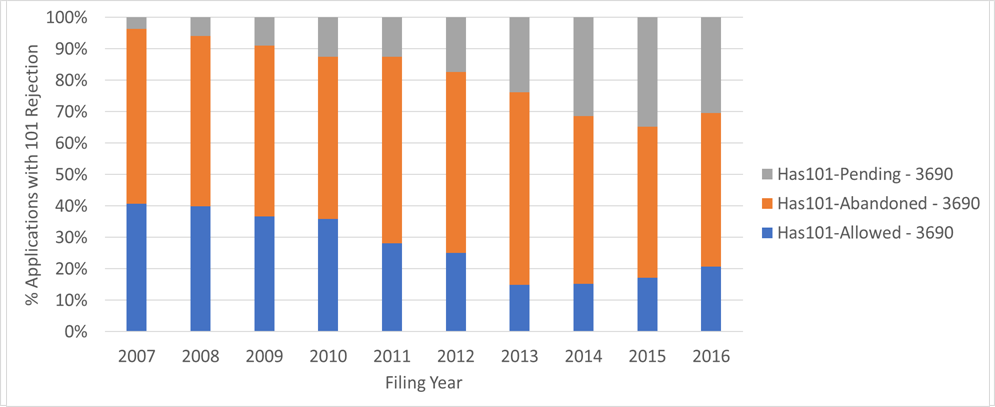
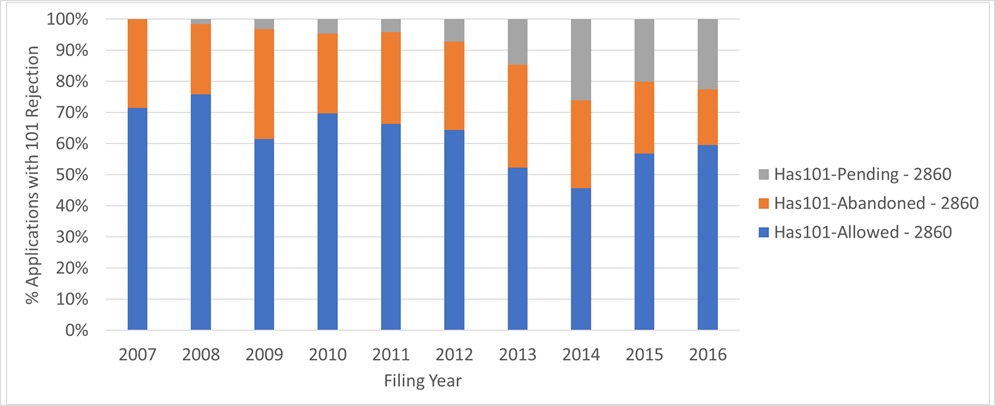
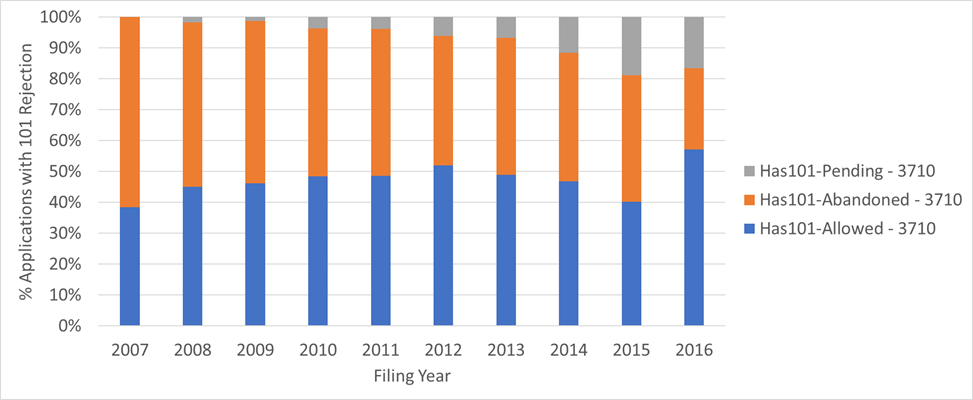
Even if we assume all pending applications eventually go abandoned, and we assume that all the abandonments were because of an inability to overcome the 101 rejection (big assumptions), allowance rates still would not be down nearly as much as I would expected given the constant stream of woe-is-the-patent-system articles I have been inundated with over the past 5 years. Under those assumptions, the biggest impact would appear to be a 25% drop in allowance rate in art unit group 3690. And – importantly – the allowance rate appears to already be recovering.
Average Number of Actions to Allowance
Average Number of Actions to Allowance (by Technology Center)
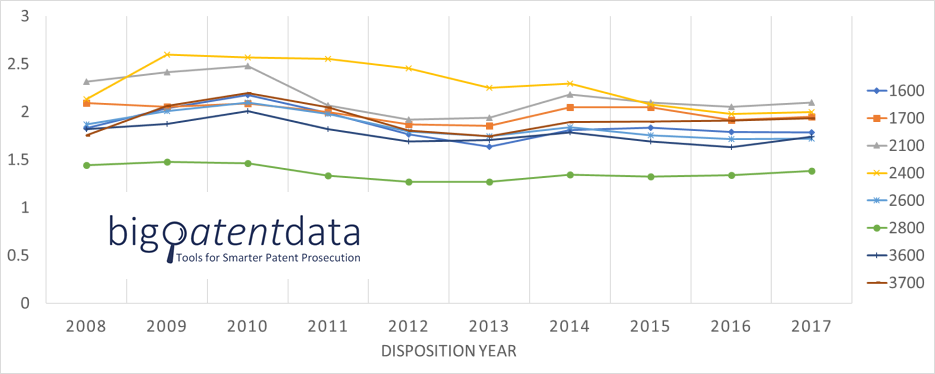
Average Number of Actions to Allowance (Art Unit Groups with Highest Rate of 101 Rejections)
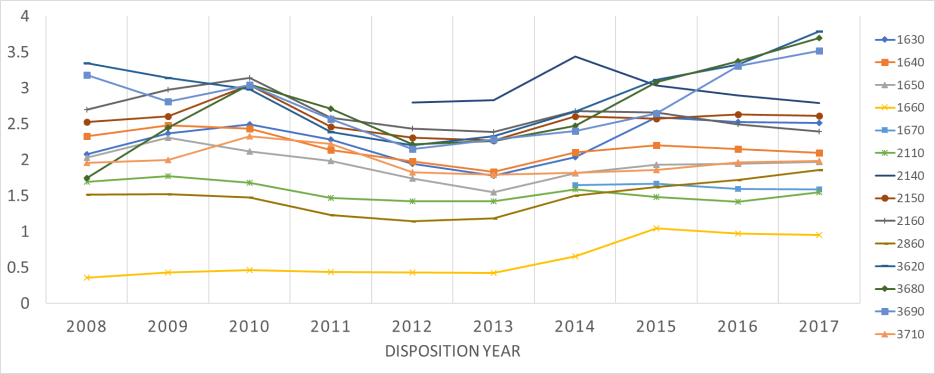
At the technology center level, the average number of office actions has had its ups and downs over the past 9 years, with swings of about 0.5 office actions. For the most-affected art units, we see art unit groups 3620 and 3690 took around 3.5 office actions to reach allowance as of mid-2017, which is ~1.5 office actions more than it took in 2012 (but only ~0.5 office actions more than it took back in 2008). The other outlier, 3680, has been on a roller coaster since 2008. All others are generally less than half an office action different than in 2012.
Conclusion
For the vast majority of technologies, Mayo and Alice have not significantly affected the allowance rates or the number of actions needed to get to allowance.
Disagree? Think my analysis is flawed? You could certainly be right and I would love to hear about it! Leave a comment or find me on LinkedIn
Looking for sample responses that successfully overcame 101 rejections? The BigPatentData file wrapper search engine has thousands of them!
I agree that the past 4-5 years of 101 discussion have been confusing in light of the real world. Were there any filing date cutoffs? The charts show the allowance rates going up even without any cutoff, but the long-pending cases were doomed before Alice and draw the numbers down. What people really want to know is: “what are my chances today?” Absent any policy changes, it appears the chances today of getting a patent are at an all-time high, which forces the courts to have near-high invalidation rates.
Pingback:Impact of Mayo and Alice -- Largely Confined to Particular Art Units
Your analysis is flawed. It doesn’t include the numbers of applications filed in the affected art units.
If attorneys are filtering out anything that isn’t allowable, that’s an effect you aren’t measuring. And you’d need to adjust for the general rise or fall in applications in all art units to see that effect.
A great point! I will put this on the list of things to look into in a follow up post. Everybody please keep poking holes in my analysis. I have no agenda and will go where the data takes me.
Pingback:Patent Riffs & Links for Oct 23, 2018
I enjoy the subject and your analysis, but the title is highly misleading. In my experience, 101 is an increasingly important issue in Technology Centers that never previously dealt with the subject. Especially as we see software permeating nearly every type of technology. Hopefully Iancu and/or the Fed. Cir. and/or Congress will bring common sense to the situation. Software is patent eligible! Let’s talk about 102 and 103, not silly 101 experiments!