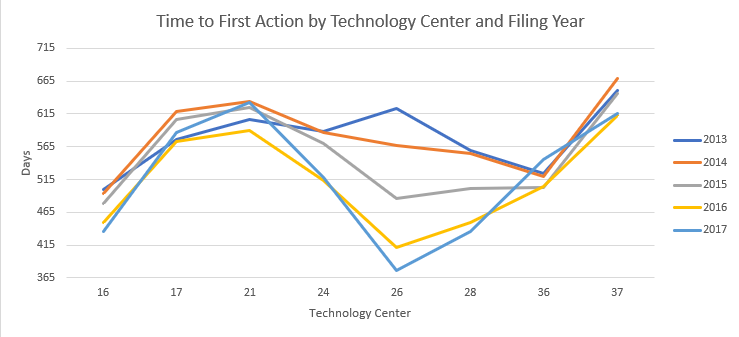
I recently charted the time from filing to first action by technology center and year, and was immediately intrigued by what I saw:
Specifically, I was intrigued by the drastic decrease in time to first action for technology center (TC) 2600 (and to a lesser extent, TC 2400 and TC 2800), while other TCs made little improvement (and even went backwards in some years).
First, as a sanity check, I compared the above chart to the PTOs pendency data for the past two years, and found the 2017 values to match very well. Since I calculated all years in exactly the same way from the same data, I am pretty sure the chart is accurate (if someone else has contradicting data, I would love to hear about it!).
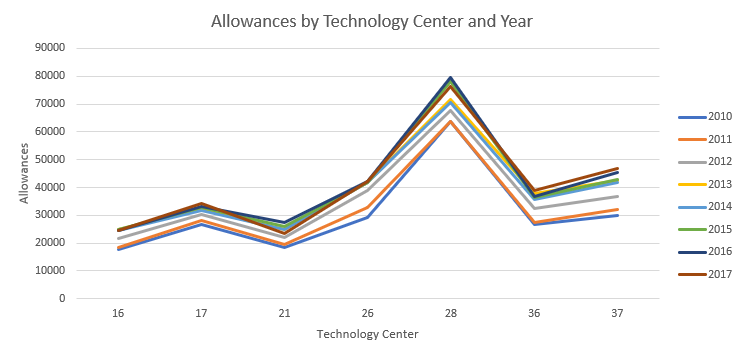
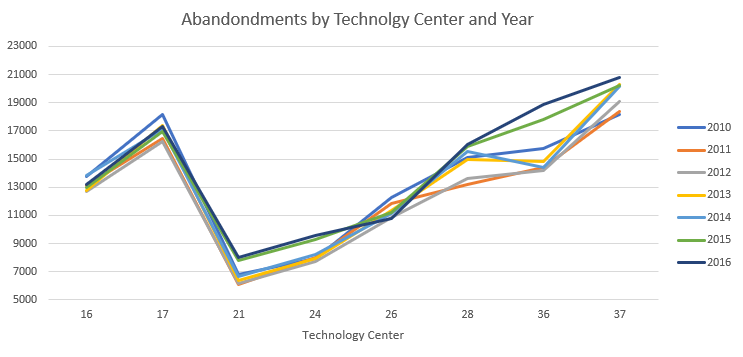
Perhaps there was an outsized increase in allowances or abandonments in technology centers 2400, 2600, and 2800?
Nope.
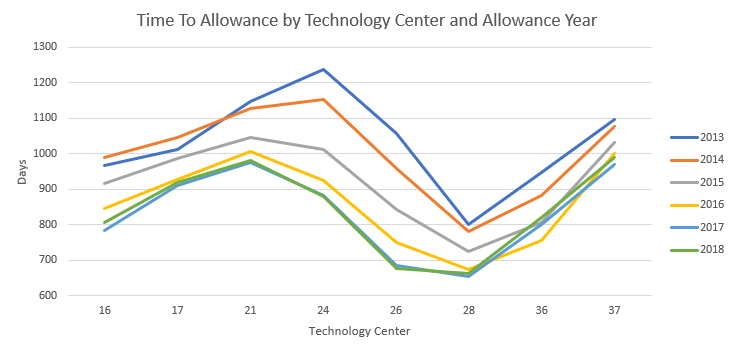
Maybe TCs 2400, 2600, and 2800 are being faster with first actions but then slower in later stages of prosecution?
Another dead end. TCs 2400 and 2600 also had biggest reductions in time to allowance.
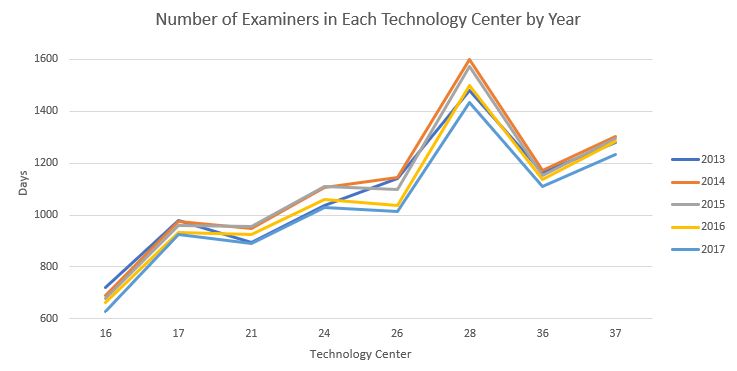
Perhaps a bunch of examiners were also added to TCs 2400, 2600, and 2800?
Again, no. While all technology centers lost examiners over the years, TCs 2600 and 2800 actually lost the most!
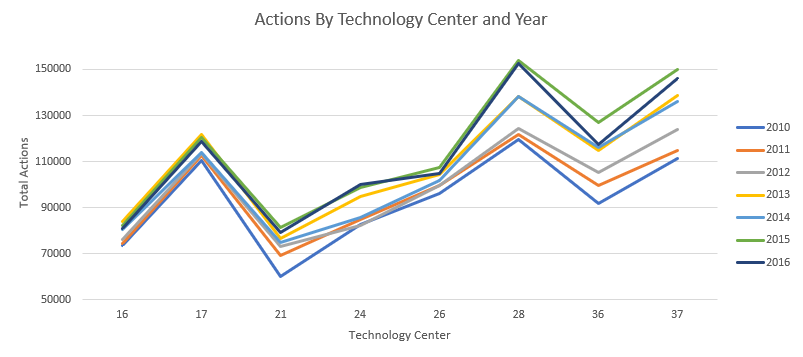
The previous graph only captures distinct examiners in each technology center. Many examiners work in multiple technology centers. Perhaps fewer examiners were spending more time in TCs 2400, 2600, and 2800?
Doesn’t seem to be the case. Using total actions as a proxy for total examiners working, the next chart shows that TCs 2800, 3600, and 3700 have seen higher growth in total actions generated than TC 2600 (a disproportionate number of those in TC3600 being Alice rejections).
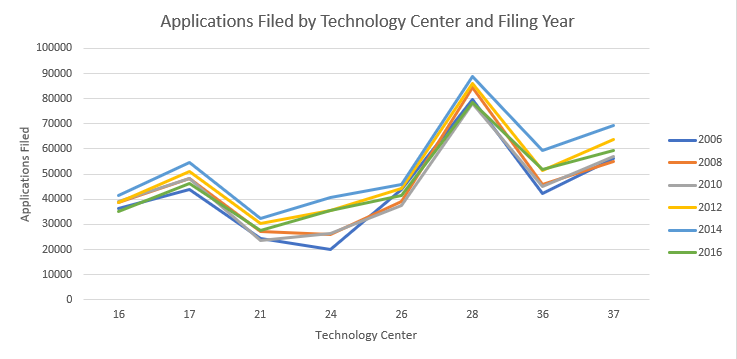
At this point I an running out of theories. Were simply fewer applications being filed in TCs 2400, 2600, and 2800?
This one may actually explain some of it — the number of new applications in TC 3600, and TC 3700 grew at about twice the rate as TC 2600 and TC 2800. But, then again, TC 1600, TC 1700, and TC 2100 grew at about the same rate (or less) than TC 2600 and TC 2800. Moreover, TC 2400 grew the most while achieving its significant reduction in time to first action.
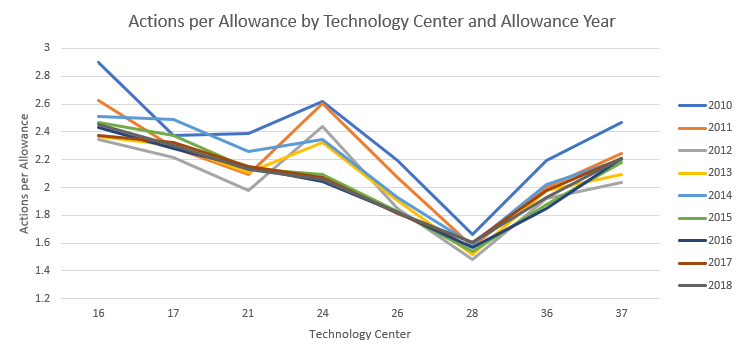
Did technology centers 2400, 2600, and 2800 simply get more efficient in terms of number of actions per disposal?
This may also explain part of it. The number of actions per allowance in TCs 2400 and 2600 decreased each year from 2010 to 2015, and have stayed near 2015 levels for the past three years. Other technology centers have seen lesser efficiency gains and have also bounced around a bit.
Conclusion
Over the past five or so years, technology center 2600 (and, to a lesser extent, 2400 and 2600) has seen a drastic reduction in time to first action and time to allowance. It appears to be partly because of slower growth in new applications in those technology centers, and partly because those technology centers are simply reaching final disposition in fewer actions. This latter point, if true, is great news (assuming patent quality remains constant or improves), because reducing the number of actions per disposal seems to be the only sustainable way to drive down delays.
If anyone has any other theories or facts about how TCs 2400, 2600, and 2800 have achieved their success, I would love to hear them!


One way for a Tech Center to keep its docket clear is to maintain a high allowance rate and ignore Alice and other issues. I’m not sure if it’s a good idea to extend that line of thinking to other art units. The allowance rate is already at an all-time high.
This one is pretty easy. TC 2600 had a bigger hiring binge before the period covered by this data. The TC has hired few or no examiners for several years now, which is reflected in the attrition seen in the examiners-per-TC data.
First, I should have noted that part (possibly most) of the examiner attrition in my data is due to more unpublished applications for more-recent years, since I looked at the examiners listed on each application to calculate the numbers.
Second, I looked for some external data on this, and found: https://developer.uspto.gov/visualization/examiner-staff-statistics-2-visuals. That link says the number of examiners in each TC from 2008 to 2015 was as follows:
TC 11/1/2008 12/1/2015 % increase
1600 498 641 29%
1700 574 890 55%
2100 569 878 54%
2600 707 1045 48%
2800 943 1457 55%
3600 656 1057 61%
3700 602 1151 91%
So, according to the link, TC 2600 staffed up less than other TCs in that time period! So, assuming equal patent quality among all TCs (admittedly a big assumption), then TC 2600 does seem to be doing better in terms of getting applicants the patents to which they are entitled in an efficient manner.
While everyone loves a good mystery, the first action pendency rate of TC 2600 is far from surprising, if you have the data and look a little further. As one of the Directors in TC 2600 since 2009, the authors conclusions are not far off. Areas in our TC have declining (like disk drives) and growing filing rates and backlogs. The net, given our examination capacity, is an over all decline in our first action pendency. Not such a bad thing, if I can say so myself. And, I would like to think our efficiency has something to do with it also, but I don’t have that data as I write this to confirm or deny. But we do encourage our management staff and examiners to indentify allowable subject matter as soon as possible, and if applicable, reach out to applicant to negotiate rather than issue subsequent actions. What’s missing from the conclusion is the earlier up-staffing we did in examiners when filing rates were much higher. In the last 3 or so years, because our examination capacity has exceeded our overall filing rates and backlog, we have hired very little if at all.